Evaluation views
What is an evaluation view?
An evaluation view allows you to view the data of a measuring point. While the measuring point stores which data is assigned, how it is calculated and how alerts are to be triggered, the evaluation view is used to display the data in the form of various diagrams and tables.
It is possible to define different evaluation views for one measuring point, according to usage. For example, one to be displayed online, one for display in a report and one specifically for export.

When creating a measuring point, one evaluation view is always automatically created. This is normally used.
Create and manage evaluation views
Edit
In the view for editing a measuring point, all available evaluation views are displayed under “Evaluation views”.
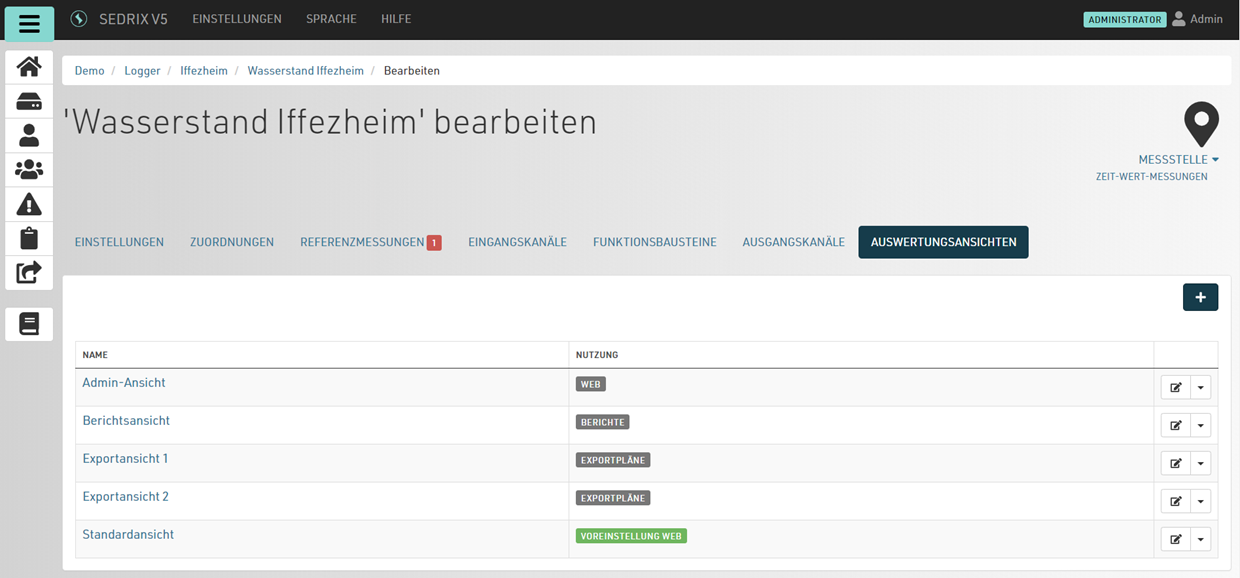
There is always a standard view which is normally displayed when you click on a measuring point.
The “Usage” column displays the intended use of this view: for the web, for reports or for data export.
This influences where this view can be used. For example, when configuring a report, only the evaluation views that are also intended for use in a report are displayed.
If you would like to edit the evaluation view you are currently looking at, there is a shortcut in the context menu. Using this shortcut allows you to directly edit the evaluation view currently being displayed.
Create
To create a new evaluation view, edit the desired measuring point and click on the Plus symbol in the “Evaluation views” tab.
Properties
General
In the window that now opens, you can set basic properties of the evaluation view in the “Properties” tab.
Name:
A name for the evaluation view. Use a name that describe the purpose of the view.Description
An optional description. The text, if available, is displayed as a subtitle in lists. For example, the field can be used to describe the usage of the evaluation view in more detail.Use as standard web view:
If the page of a measuring point is called up, the web view specified as the default is used.
If the switch is activated, the current view becomes the standard view (there can only be one standard view per measuring point).Can be used in web
If this field is activated, this view is listed in the context menu as another possible view.Can be used in reports
If this field is activated, this view can be used when generating a report.Can be used for export
This field sets whether the evaluation view can be used for data export.
There can only be one standard web view per measuring point.
As soon as you define a new view as the “standard”, the previous one is no longer the standard view.
Export: Folders
The folder hierarchy in which the exported data is to be stored can be defined here for the export of an evaluation view.
A basis folder can be defined and a folder hierarchy can be configured according to time aspects.
Export: Data formats
To be able to export an evaluation view, the data formats for graphs , tables etc. in which the measurement data is exported during an export process are defined here.
Export: Region and time
Normally the settings for region and time are taken from the project properties. These settings can however be overwritten for an export.
Evaluations
The content of the evaluation view can be set in the “Evaluations” tab, i.e. graphs and tables to display the measuring point data.
To enable editing here, a name for the view must first be entered under “Settings” and confirmed with “Save”. Only then is editing possible.
The desired evaluations can now be added to the evaluation view.
Export jobs
A list of the most recent export jobs is displayed here. These can be created either by a manual export or automatically by an export plan.
Add graphs or tables to an evaluation view
Clicking on the “Add” button opens a pop-up menu. The desired evaluation can then be selected from the list and added to the view. Use this block to build the evaluation view according to your needs.
If an evaluation is added to the view, it must still be configured.
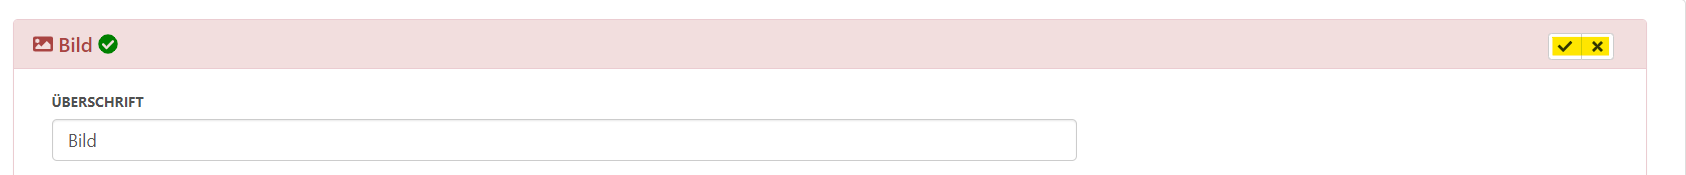
Heading:
A text can be entered in this field, which then appears as a heading above the corresponding element in the web view or in the report.Visibility:
This item can be used to specify whether the corresponding block is visible to all users or only to administrators.
The other fields differ depending on the block type. For example, the value axis and aspect ratio can be set for a graph, the number of columns for a table, etc.
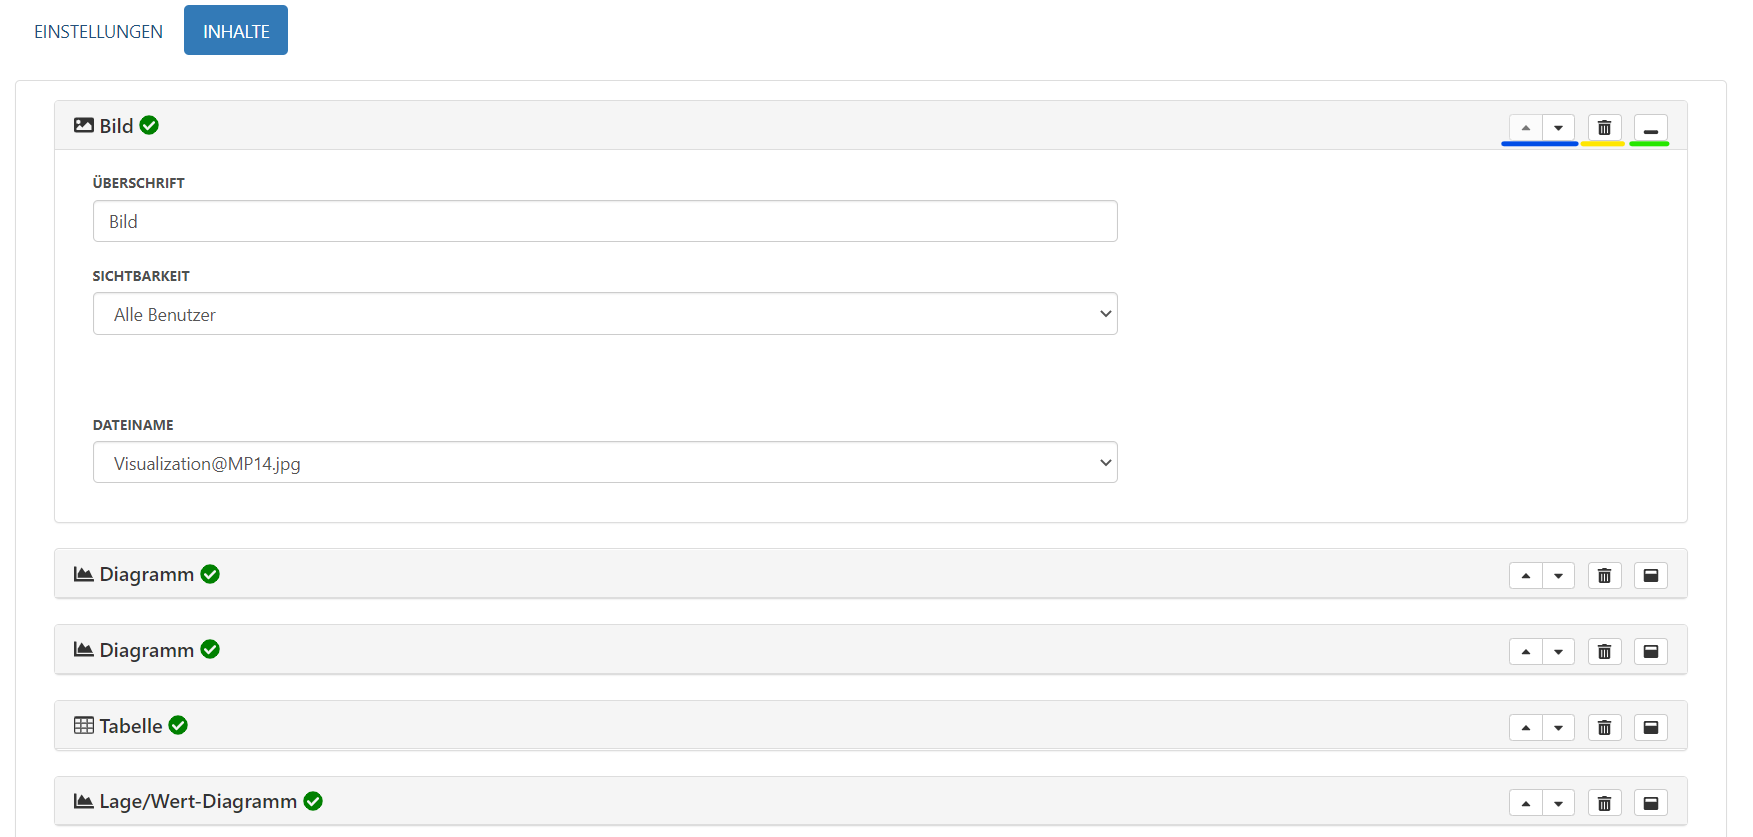
The buttons on the right side of each block offer further configuration options.
Both of the arrow icons (highlighted in blue in the image) allow you to move the block by one position, i.e. above or below the following block.
The trashcan icon (highlighted in yellow) deletes the corresponding block. After clicking on the icon, new icons appear in the block title bar. Clicking on the checkmark confirms the deletion, clicking on the cross icon cancels it.
The minimize icon (highlighted in green) minimizes a block to show just its title. Clicking again expands the block back to the detailed view.

Once all the desired adjustments have been made, the changes can be saved by clicking on the “Save” button.
Switch between multiple views
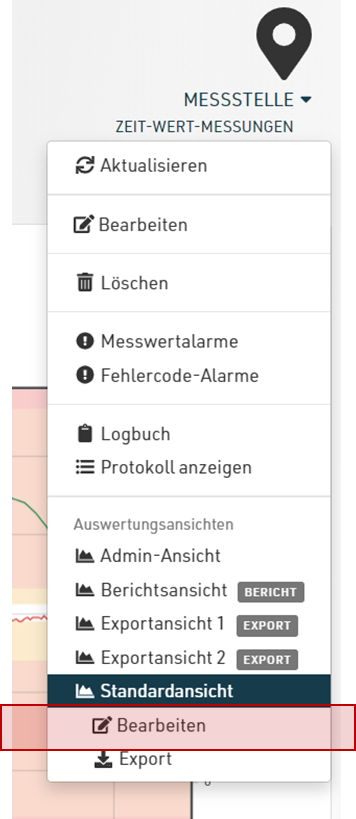
There can be multiple evaluation views per measuring point. In order to be able to easily switch between multiple views, they are listed in the context menu of the measuring point:
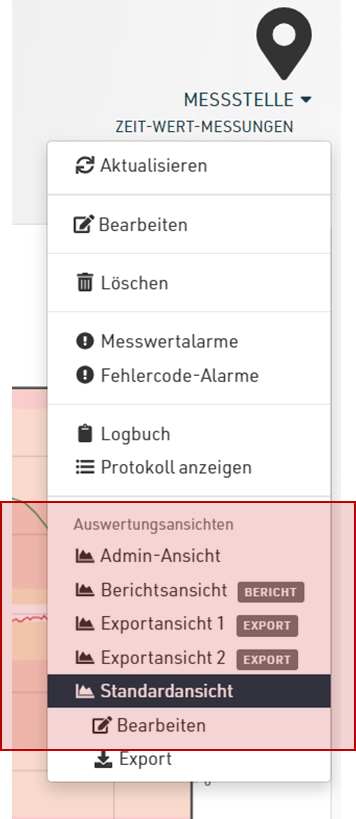
The view currently being used is marked. You can switch to another view by clicking on it.
The current view can be directly edited as well as exported using the context menu.
Use evaluation views in reports
To create a report, a report template is first required.
All the necessary information about creating and managing report templates can be found here.
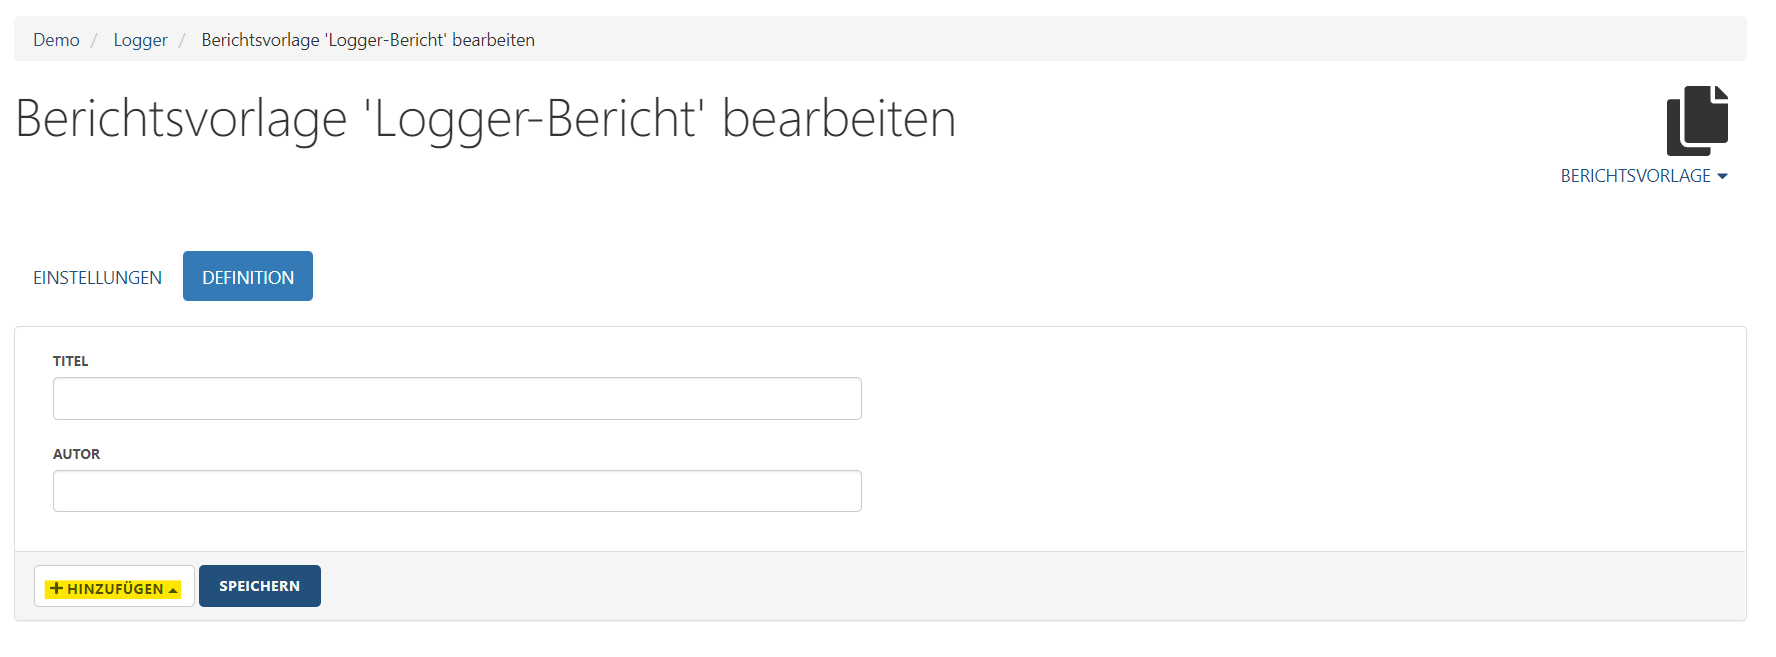
A new report template contains two tabs: “Properties” and “Definition”.
The actual content of the report is set under “Definition”.
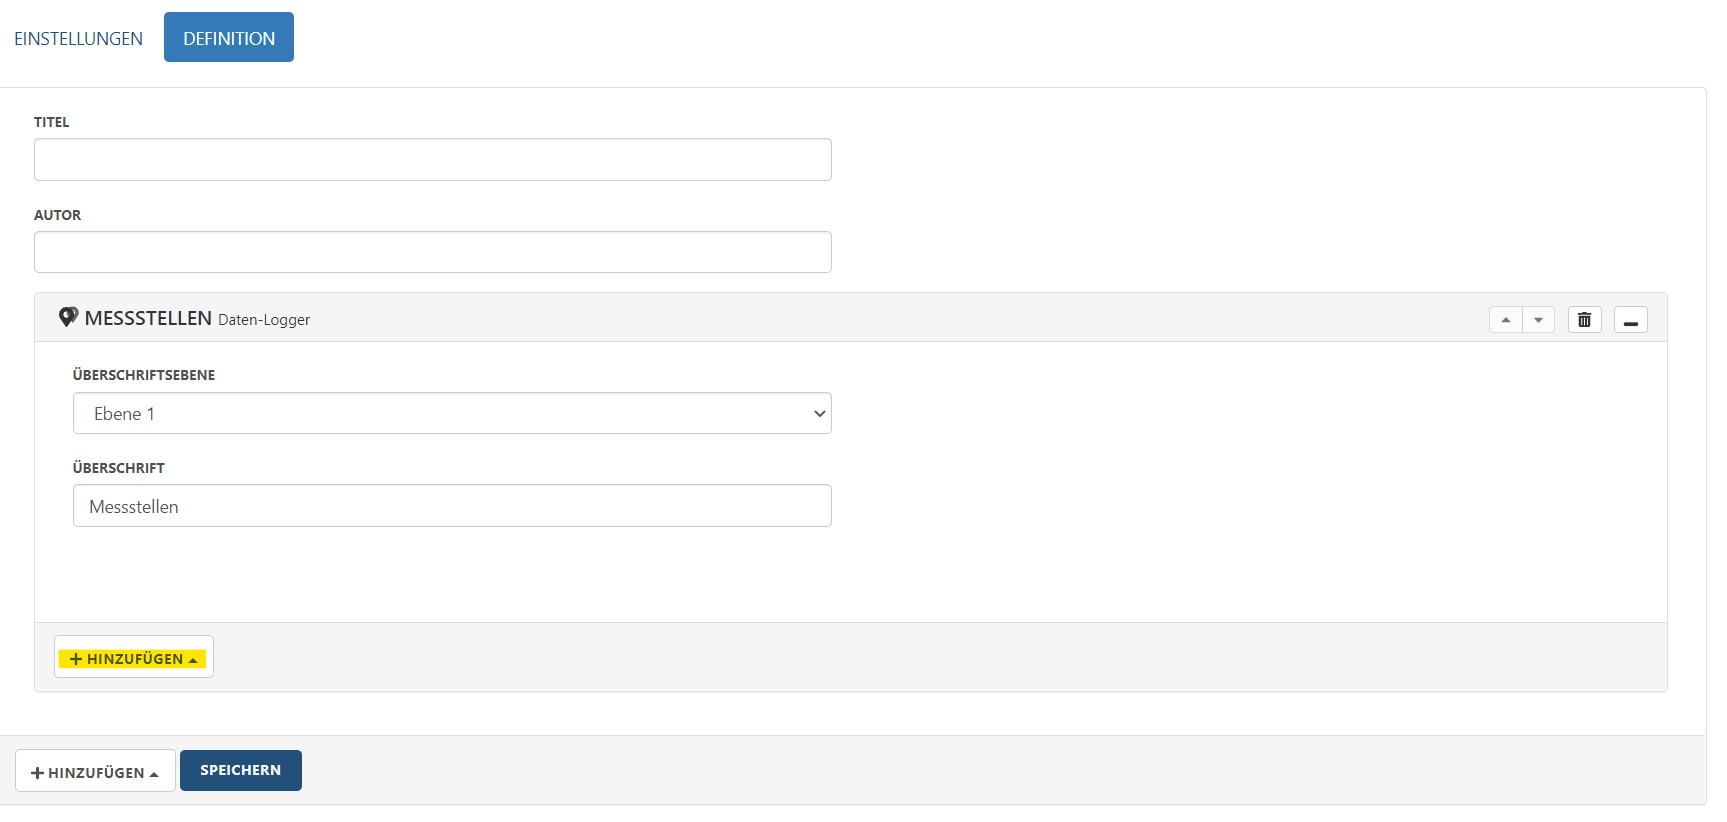
Open the “Definition” tab of the report template. First enter a title for the report template under “Title” and if necessary the author” in the “Author” text field. Then click on the “Add” button.
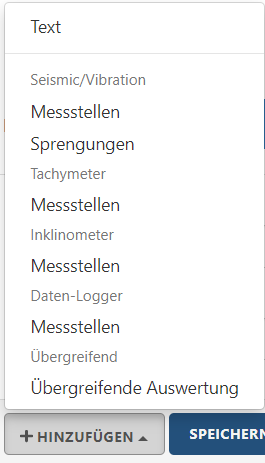
Now use the list to select the measuring point type to which the template should be added.
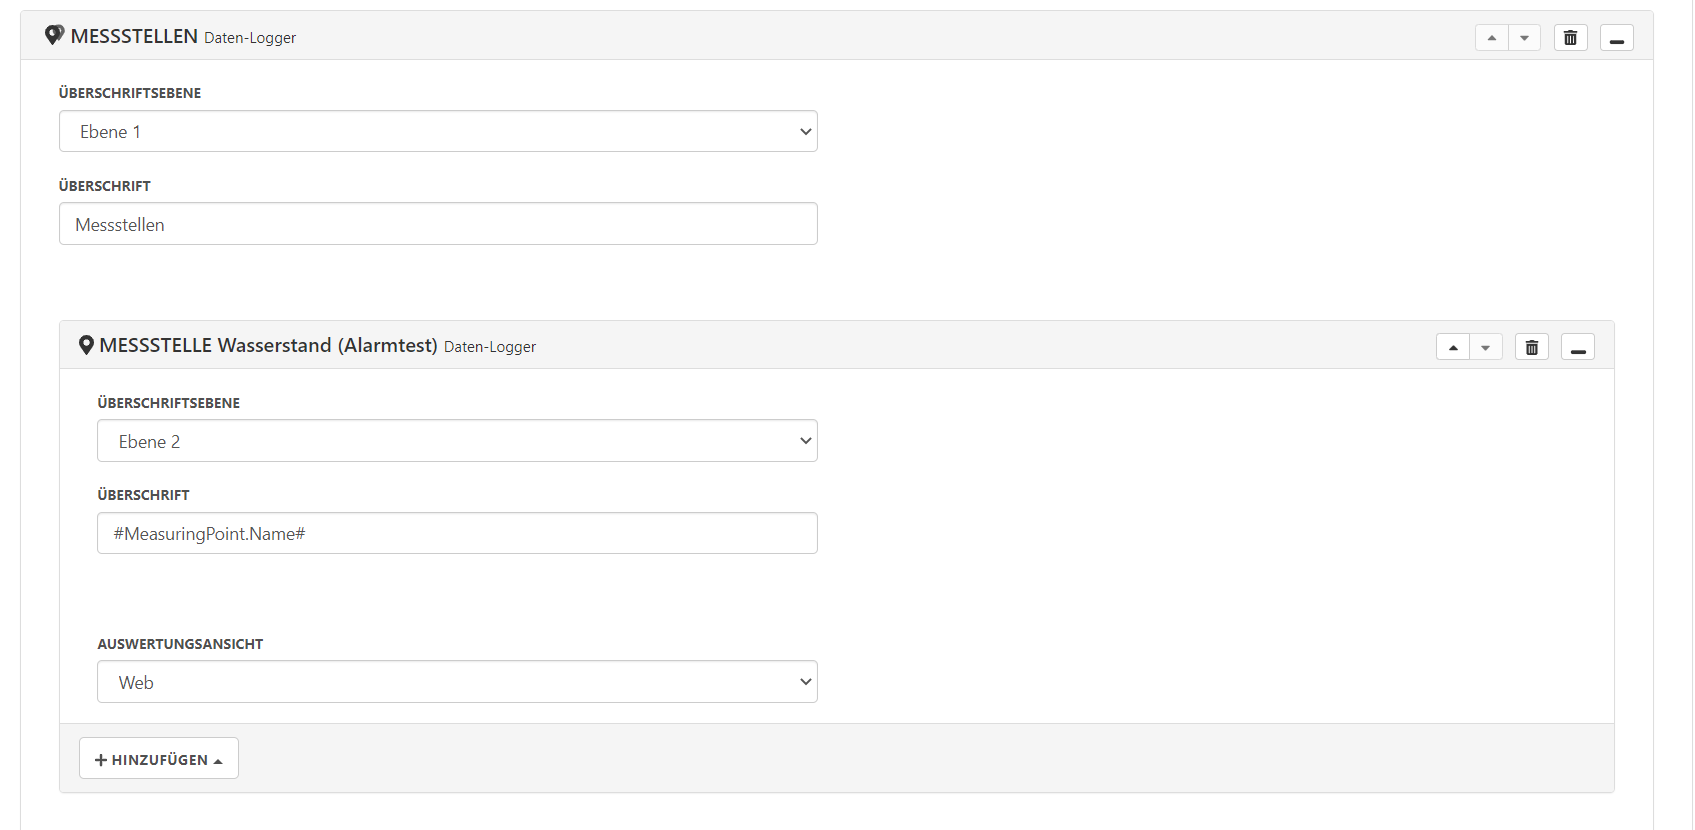
Using the fields that now appear, the created measuring point area can be given a header. The two fields are:
Header level:
Dropdown menu to set how the header is formatted according to the document template.
”Level 1” of the text formatting corresponds to “Header 1” of the document template.Header:
This field can be used to enter the header text.
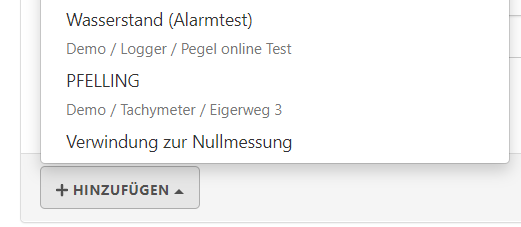
Click on “Add” in the area concerning the measuring point type to add a specific measuring point from the current project.
In the selection menu that now appears, all measuring points of the selected type that are available in the project are displayed. Click on the desired measuring point to select it.
The selected measuring point now appears in the report template. A name for the measuring point can be entered in the “Header” field. The placeholder #MeasuringPoint.Name# can be used to automatically add the name of the measuring point as a header in the report.
The “Evaluation view” field is the central part of this block. Clicking on this field displays each measuring point evaluation view that can be used in reports. The desired view can be selected here. One advantage of the evaluation views is that you can check in advance how the measuring point will be displayed in the report. To do this, call up the corresponding measuring point in the browser and switch the view to the evaluation view used in the report.
Use the “Add” button directly beneath the individual measuring point to place free text below the measuring point.