
How can I add graphs or tables to an evaluation view?
Clicking on the “Add” button opens a pop-up menu. The desired evaluation can then be selected from the list and added to the view. Use this block to build the evaluation view according to your needs.
If an evaluation is added to the view, it must still be configured.
Heading:
A text can be entered in this field, which then appears as a heading above the corresponding element in the web view or in the report.Visibility:
This item can be used to specify whether the corresponding block is visible to all users or only to administrators.
The other fields differ depending on the block type. For example, the value axis and aspect ratio can be set for a graph, the number of columns for a table, etc.
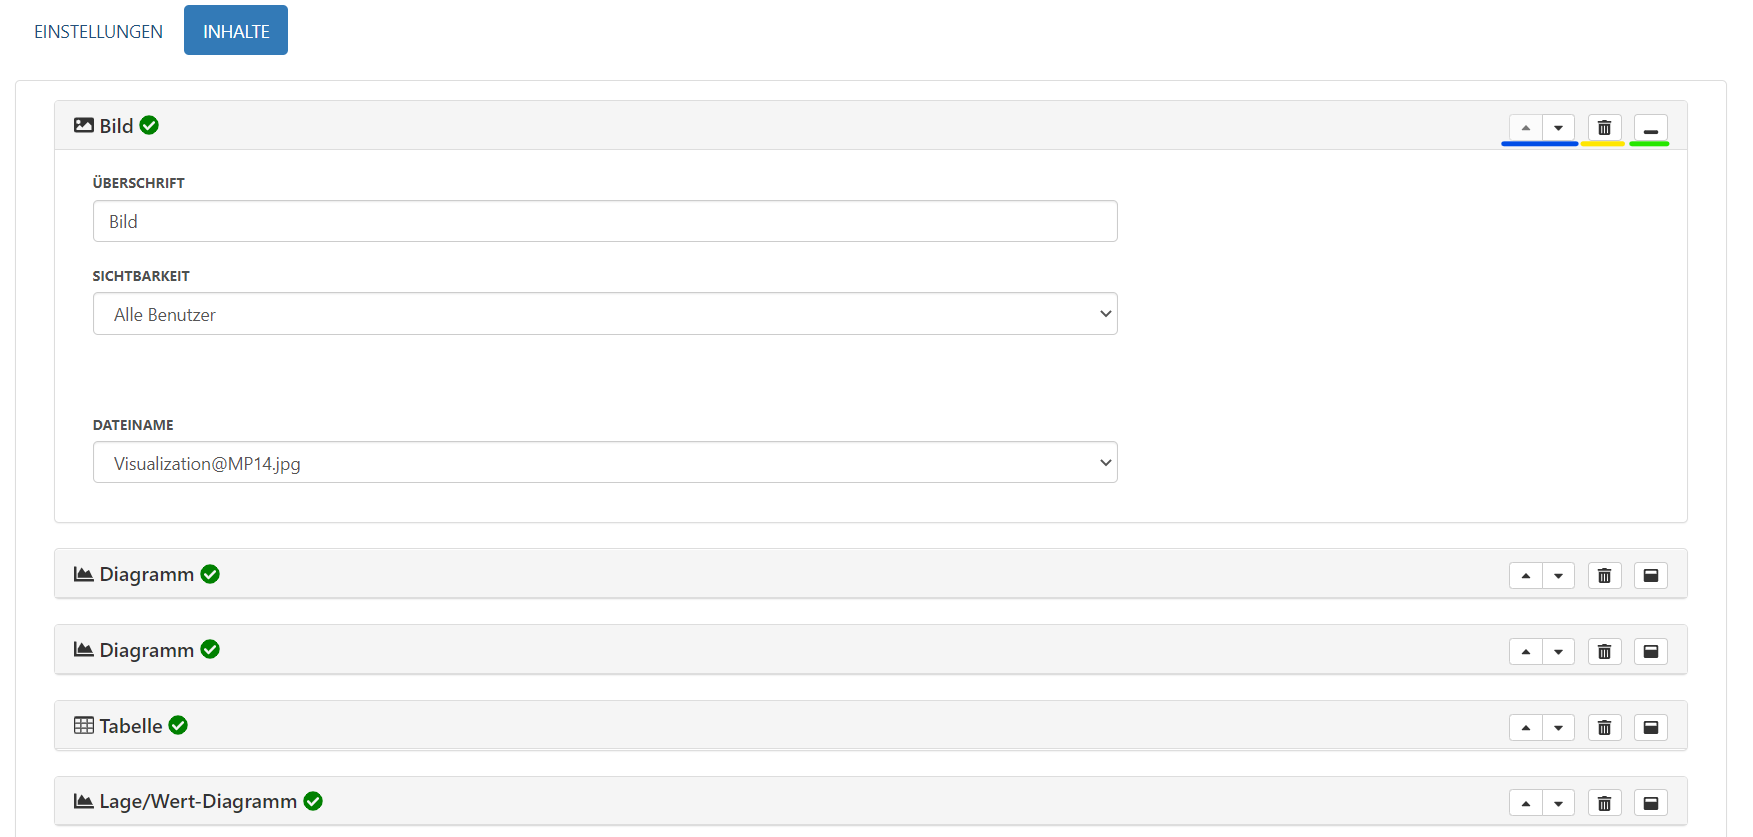
The buttons on the right side of each block offer further configuration options.
Both of the arrow icons (highlighted in blue in the image) allow you to move the block by one position, i.e. above or below the following block.
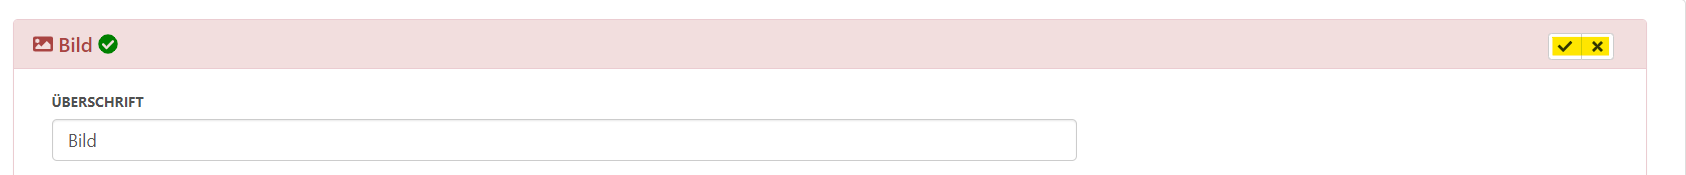
The trashcan icon (highlighted in yellow) deletes the corresponding block. After clicking on the icon, new icons appear in the block title bar. Clicking on the checkmark confirms the deletion, clicking on the cross icon cancels it.
The minimize icon (highlighted in green) minimizes a block to show just its title. Clicking again expands the block back to the detailed view.

Once all the desired adjustments have been made, the changes can be saved by clicking on the “Save” button.