Device and Data Source Management
What are devices and data sources?
Devices and data sources refer to many different suppliers of measurement data, that transmit data to Sedrix.
In the simplest case, these are for example data loggers that upload data, i.e. measurement devices.
A data source can also be the connection to another system, such as Water Level Online (see https://www.pegelonline.wsv.de). This is a service that provides the water levels of German waters via a so-called web API. Sedrix automatically retrieves the data according to a schedule.
Devices and data sources deliver the measurement data that you work with in Sedrix.
Overview of devices and data sources
The list of all devices and data sources shows all available data sources and is the main entry point for managing these sources.
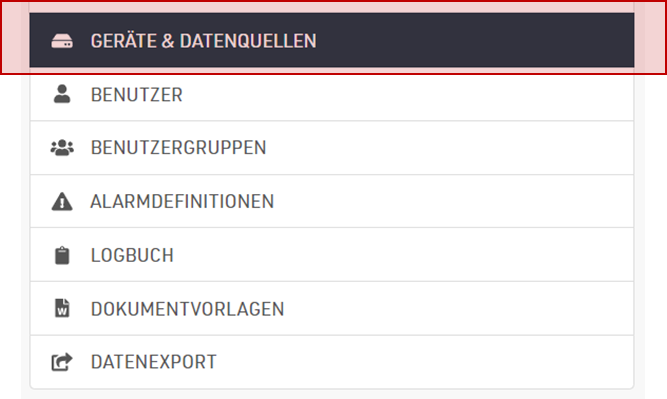
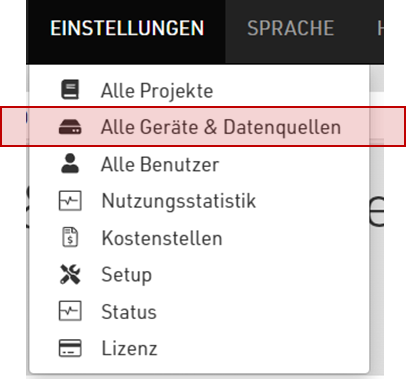
This is reached via the devices symbol on the left-hand side or in the menu:


The following important information is shown:
Time of the last transfer of data
This means that you can easily see if a device is offline or defect.Service alerts or errors
If a device has not sent data for a long time or there was an error when importing data, this will be shown hereRemote access
If available, you can access the web interface of the device via remote access here
Cross-project overview
By default, all data sources and devices within a project are displayed in the overview. However, if you want to view the entire range of devices at once, you can use the menu to access the cross-project overview.

The list essentially looks the same, but with the addition of the ‘Project’ column to show which project the device or data source belongs to.
This function depends on the assigned rights. If you require access to this function, please contact your administrator, your sales partner or support@sedrix.com!
How can I monitor a device or data source?
Monitoring if data has been sent
If a device or data source does not transmit the information, SEDRIX knows nothing about the detailed status of a device. But we can simply determine when data was last transmitted and thus determine the “online status” of a device.
In this context, “online” means that a device has sent data within a certain time interval. This expected time interval is defined in an alert definition and then assigned to the device.
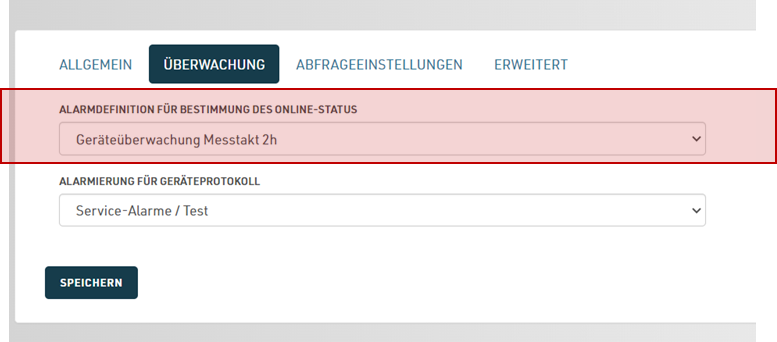
The assignment is made in the “Monitoring” tab in the properties of the device.

If a device becomes offline, an “online status” service alert is produced and the user groups that were specified in the alert definition are notified. In this way, the relevant service technicians can be informed in good time and measures can be taken.
Monitoring if errors have occurred
A second type of monitoring is carried out via the device log. This can be checked for certain error numbers. These are determined in a corresponding alert definition and then assigned to the device.
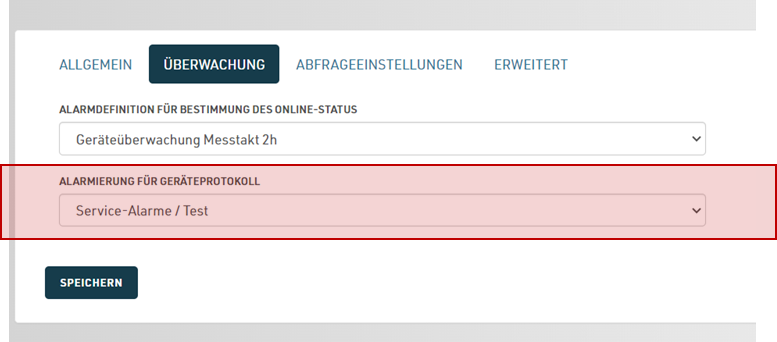
The assignment is made in the “Monitoring” tab in the properties of the device.

If a specific log entry occurs, a “log alert” is generated and the user groups specified in the alert definition are notified.
What does a the online status of a data source show?
The online status is determined from the time of the last data transmission and an alert definition assigned to the device, which determines the interval at which it can be assumed that a device is offline.
Example:
In the alert definition, it is defined that the device is considered offline if it has not supplied any data for 2 hours. A warning should be issued after 1 hour.
A device has now not sent any data for 65 minutes. According to the alert definition, a service alarm is generated with a warning that this device could be offline.
If it continues to not send data, another service alert is generated after 2 hours with the message that this device is offline.
How can I see if a data import was successful?
To see whether the import of data has been successful, there are two helpful views: the import queue and the device log.
How can I see which data was imported?
If you click on a device or data source, an overview opens in which properties, import settings and measurement channels are shown.
Here you can see which data is available.
What does remote access mean?
Menhir and MCC TSC devices have their own web interface which you can connect to via the device overview.
How can I add a device or data source?
Add a seismic/vibration measurement device
The “seismic/vibration measurement devices” that Sedrix currently supports are the Menhir (Semex EngCon) and the MR3000 (Syscom Instruments SA). These devices are not explicitly/manually added to Sedrix by the user, rather they “make themselves known” to “their” Sedrix by beginning to upload data to Sedrix after the necessary configuration has been carried out on the device.
To configure the device you require the name of the “target Sedrix” and the device password that your system administrator added to Sedrix for you (“Setup” view). Please refer to each devices’s documentation.
Add Menhir
Setting up a Menhir device (Semex EngCon) is done automatically: it is not added manually to Sedrix, rather it “makes itself known” to “its” Sedrix by beginning to upload data (via direct connection).
Add MR3000
Setting up a MR3000 (Syscom Instruments SA) is done automatically: it is not added manually to Sedrix, rather it “makes itself known” to “its” Sedrix by beginning to upload data (via FTP).
Important: After a Syscom device has been added to Sedrix, the correct time zone must be set.
In Device Management, click on the “Edit” icon on the right in the line that describes the device.
Click on the “Region and Time” tab.
Select the desired timezone in the “Time Zone” dropdown menu.
If necessary, deactivate the “Automatically change to summer time” switch.
Click on “Save” to save your changes.
Add a tachymeter device
Sedrix currently supports two types of “tachymeter”:
MCC TSC (Tachymeter Smart Control): this “tachymeter control device” is not explicitly/manually added to Sedrix by the user, rather it “makes themselves known” to “its” Sedrix by beginning to upload data after being configured accordingly.
Data source for tachymetric data (since version 2.12): is added manually.
To configure a tachymeter control device you require the name of the “target Sedrix” and the device password that your system administrator added to Sedrix for you (“Setup” view). Please refer to each devices’s documentation.
Add MCC TSC
Setting up a MCC TSC (Glötzl) is done automatically: it is not added manually to Sedrix, rather it “makes itself known” to “its” Sedrix by beginning to upload data (via direct connection).
Add general data source for tachymetric data
A “data source for tachymetric data” data source is used to read tachymeter data given as a CSV format file (e.g. from manual measurements).
To use this kind of data source and for a description of these formats, see the Import Manually Measured Tachymeter Data section.
Proceed as follows to add this type of device:
First select the project to which the device should be added.
Open Device Management.
In the top right above the list of devices, click on the “+” icon and then select “Data source for tachymetric data” in the context menu that opens. A new view will open, in which you can specify the properties of the device.
“General” tab
Make changes in this tab first and click on “Save” to add the device.
Name
Text field to enter a name (unique within the project) for the device.Description
Text field to enter a description (optional).Serial number
A number automatically added by Sedrix (UUID), for examplef30dbefa-79f2-4803-b9aa-ca1dfbc61cec. Used by Sedrix to (globally) identify the device.Coordinate system
Dropdown menu to select the desired coordinate system.Import folder
Text field to enter the path to the folder in the file system in which the the files should be placed, relative to the project folder, ended with the\symbol (backslash).
Default:Tachymeter\<Seriennummer>\, im Beispiel:Tachymeter\f30dbefa-79f2-4803-b9aa-ca1dfbc61cec\.
Contact your system administrator if necessary.
The folder is created once you click on “Save” (at the bottom).Import format
Dropdown menu with the two options “Sedrix Tachymeter CSV” and “Tachymeter XML (MCC TS)”.
For a description of this formats see the Import Manually Measured Tachymeter Data section.Start data for data import
Calendar widget to select the point in time from which data is to be imported.
Pay attention to the messages Sedrix displays here.Archived
Slide switch to set whether the device should be archived or not.
Default: “No”.
Click on “Save” to create the device and then make any further changes in the “Device monitoring” tab.
“Device monitoring” tab
Alert definition to monitor online status
Dropdown menu to select an “Online status alerting” alert definition.
When the project was created, this type of alert definition named “Standard device monitoring” was created, and can be selected here.
This feature requires special licensing, see the Alerting section.Device log alerting
Dropdown menu to select a “Log notification alerting” alert definition.
This feature requires special licensing, see the Alerting section.Measurement log alerting
Dropdown menu to select an alert definition.
This feature requires special licensing, see the Alerting section.
Click on “Save” again.
Important: The license entries required to operate the device must first be created by us. To do this, we need the number displayed in the "General" tab under "Serial number" (UUID), for example b3c4d4c1-34ea-4f6f-92fc-06776aee5526. This so-called UUID, which was automatically assigned when the device was saved, is used to uniquely identify the device. Please contact your Sedrix account manager or Remolution Software GmbH to obtain a license, stating the UUID.
Add Devices and Data Sources for Time-Value Data (Measurement stations, data loggers…)
Currently, devices of all types need to be added manually (even those that are configured to upload their data via FTP to “their” Sedrix, as a “Glötzl MCC” does). Start by clicking on the “+” in the top right, select one of the following device types and proceed according to the relevant detailed description linked below:
“Glötzl MCC”: See Add Glötzl MCC
“Glötzl Logger”: See Add Glötzl Logger
“Virtueller Datenlogger”: See Add virtual data logger
Add Glötzl MCC
Proceed as follows to set up a “Glötzl MCC” (measurement station) device:
In Device Management, click on the “+” button in the top right.
In the context menu that opens, select the desired device type. In this case: “Glötzl MCC”.
Enter the relevant information in the view that opens.
“General” tab
Name
Text field to enter a name for the MCC that is unique within the projectDescription
Text field to enter a description (optional)Serial number
Text field to enter the serial number of the MCCVersion
Text field to enter the version of the MCC (currently optional)Import folder
Text field to enter the path to the folder in the file system into which the MCC data should be imported, relative to the project order, ending with the\symbol (backslash).
Default: Path to the import folder defined when setting up the Sedrix, followed by00000000\as the name of the actual import folder. Replace this sequence of zeros with (typically) the serial number. If necessary, contact your system administrator about this path.
The folder is created as soon as you click on “Save” (at the bottom).
Important: This path must correspond to the export folder when configuring the MCC.
Import format
Dropdown menu with the two options “Glötzl CSV” and “Sedrix Logger CSV”.Start date for data import
Calendar element to specify the point in time from which data is to be imported.
Pay attention to the warnings displayed in Sedrix here.
Click on “Save” to add the device, and then make any further changes in the “Device Monitoring” tab.
“Device Monitoring” tab
Online status alert definition
Dropdown menu to select an “Online status alerting” alert definition.
When creating the project, an alert definition with the name “Standard device monitoring” is created, which can be selected here.Device log alerting
Dropdown menu to select an “Log notifications alerting” alert definition.
This feature requires separate licensing, see the section on Alerting.
Click on “Save” again.
Add Glötzl Logger
Proceed as follows to set up a “Glötzl Logger” device:
In Device Management, click on the “+” button in the top right.
In the context menu that opens, select the desired device type. In this case: “Glötzl Logger”.
Enter the relevant information in the view that opens.
“General” tab
Name
Text field to enter a name for the device that is unique within the projectDescription
Text field to enter a description (optional)Serial number
Text field to enter the serial number, e.g.0012
Default:0000.Version
Text field to enter the versionImport folder
Text field to enter the path to the folder in the file system into which the MCC data should be imported, relative to the project order, ending with the\symbol (backslash).
Default:Logger\<Seriennummer>\, in this example:Logger\0012\. If necessary, contact your system administrator about this path.
The folder is created as soon as you click on “Save” (at the bottom).Import format:
Dropdown menu with the two options “Glötzl CSV” and “Sedrix Logger CSV”.Start date for data import
Calendar element to specify the point in time from which data is to be imported.
Pay attention to the warnings displayed in Sedrix here.Archived
Slide switch to specify whether the device should be archived or not.
Default: “No”
Click on “Save” to add the device, and then make any further changes in the “Device Monitoring” tab.
“Device Monitoring” tab
Online status alert definition
Dropdown menu to select an “Online status alerting” alert definition.
When creating the project, an alert definition with the name “Standard device monitoring” is created, which can be selected here.
This feature requires separate licensing, see the section on Alerting.Device log alerting
Dropdown menu to select an “Log notifications alerting” alert definition.
This feature requires separate licensing, see the section on Alerting.
Click on “Save” again.
Add a Virtual Data Logger
A “virtual data logger” device allows you to manage data from data services such as “Water Level Online WSV” (https://www.pegelonline.wsv.de).
Add a virtual data logger
First select the project to which the data logger being created should be added.
Open Device Management.
Click on the “+” icon in the top right above the list of devices and then select “Virtual data logger” from the context menu that opens.
First add a name for the device in the “General” tab of the view that opens and click on “Save” to add the device.
Only after saving can you make changes in the other tabs.
In particular, channels can only be created (see below) once the device has been licensed. Please refer to the following info box for all further steps!
Then return to Device Management. The new device is now displayed here.
Important: The license entries required to operate the device must first be created by us. To do this, we need the long character string displayed in the ‘Device info’ column in the device management, e.g. 4e8096dd-aa1f-4f85-b667-12baa615aeee. This so-called UUID, which was automatically assigned when the device was saved, is used to uniquely identify the device. Please contact your Sedrix account manager or Remolution Software GmbH to obtain a license, stating the UUID.
Create channels
Channels are created under the ‘Channels’ tab, here using the example of ‘Water level online WSV’. One channel must be created here for each level to be displayed.
Proceed as follows for each channel to be created:
Click on ‘+’ in the top right and select the desired type in the context menu, in this case: ‘Water level online WSV’, in the context menu. In the view that appears, enter the following:
In the ‘General’ tab:
A (unique) name
The number of digits before and after the decimal point, as required
The unit of the channel, e.g. for water level: ‘m’.
In the ‘WATER LEVEL ONLINE WSV’ tab:
Under ‘Number’ the gauge or measuring point number, or under ‘UUID’ the UUID of the gauge (UUID takes precedence; you can find this information in the ‘Master data’ of a gauge at https://www.pegelonline.wsv.de)
Under ‘Channel’, ‘Short name’ e.g. ‘W’ for ‘Water level’
The remaining details are added automatically after saving and the resulting internal query in ‘Water level online WSV’.
To integrate the data logger into a logger measuring point, see Assigning a data logger channel to a data logger measuring point.
Setting up passive device monitoring
This is done in the ‘Device monitoring’ tab. For details, see Setting up device monitoring.
See also: Setting up device monitoring, Assigning a data logger channel to a data logger measuring point.
Add Data Source for Time-Value Data
A “data source for time-value data” device type is used to read logger data given as a file in a particular CSV format (e.g. from manual measurements).
To use a device of this type and for a description of this format, see Import Manually Measured Logger Data.
Proceed as follows to add a device of this type:
First select the project to which the data logger being created should be added.
Open Device Management.
Click on the “+” icon in the top right above the list of devices and then select “Data source for time-value data” from the context menu that opens. A new view opens to specify the properties of the device being created.
“General” tab
Enter information in this tab first and then click on “Save” to add the device. Only then should you switch to the “Device Monitoring” tab.
Name
Text field to enter a name for the device that is unique within the projectDescription
Text field to enter a description (optional)Serial number
A number automatically set by Sedrix (UUID), for examplea9c78453-72d3-4c67-9f97-34814f2b4545, used to (globally) identify the device in SedrixVersion
Text field to enter the versionImport folder
Text field to enter the path to the folder in the file system into which the MCC data should be imported, relative to the project order, ending with the\symbol (backslash).
Default:Generic\<Seriennummer>\, in this example:Generic\a9c78453-72d3-4c67-9f97-34814f2b4545\. If necessary, contact your system administrator about this path.
The folder is created as soon as you click on “Save” (at the bottom).Import format:
Dropdown menu with the two options “Glötzl CSV” and “Sedrix Logger CSV”.
See Import Manually Measured Logger Data for a description of these formats.
Click on “Save” to add the device, and then make any further changes in the “Device Monitoring” tab.
“Device monitoring” tab
Online status alert definition
Dropdown menu to select an “Online status alerting” alert definition.
When creating the project, an alert definition with the name “Standard device monitoring” is created, which can be selected here.
This feature requires separate licensing, see the section on Alerting.Device log alerting
Dropdown menu to select an “Log notifications alerting” alert definition.
This feature requires separate licensing, see the section on Alerting.
Click on “Save” again.
Important: The license entries required to operate the device must first be created by us. To do this, we need the long character string displayed in the ‘Device info’ column in the device management, e.g. 4e8096dd-aa1f-4f85-b667-12baa615aeee. This so-called UUID, which was automatically assigned when the device was saved, is used to uniquely identify the device. Please contact your Sedrix account manager or Remolution Software GmbH to obtain a license, stating the UUID.
Add Inclinometer Data Source
Proceed as follows to set up a data source for measurements with an inclinometer probe:
In Device Management, click on the “+” icon in the top right above the list of devices.
In the context menu that opens, select the desired device type, either Glötzl GLM or GLNP.
Enter the relevant information in the view that opens.
“General” tab
Name:
Text field to enter a name for the data source that is unique within the projectDescription:
Text field to enter a description (optional)Serial number:
Text field to enter the serial number; completed automaticallyVersion:
Text field to enter the GLM version (optional)Import folder:
Text field to enter the path to the folder in the file system in which the GLM data should be imported, relative to the project folder.
The folder is created once you click on “Save” (at the bottom).
Important: This path must correspond to the export folder when configuring the GLM.
Import format:
Dropdown menu with the supported data formatsStart date for data import:
To enter the time point at which data should begin to be imported
Click on “Save” to add the data source and then make any further changes in the “Device monitoring” tab.
“Device monitoring” tab
Online status alert definition
Dropdown menu to select an “Online status alerting” alert definition.
When creating the project, an alert definition with the name “Standard device monitoring” is created, which can be selected here.
This feature requires separate licensing, see the section on Alerting.Device log alerting
Dropdown menu to select an “Log notifications alerting” alert definition.
This feature requires separate licensing, see the section on Alerting.
Click on “Save” again.
