Device and Data Source Management
Introduction
In the Device Management view, all devices and data sources of the current project are clearly listed along with their essential properties. In addition, the properties of existing devices or data sources can be edited in this view. New devices or data sources can also be added to the project. See the Device Overview section.
To access the device management of the current project, click on the “Devices” icon (
From version 2.12, Sedrix also offers a device overview across all projects. This provides a quick overview of all devices within your Sedrix, regardless of which projects they are currently assigned to. See Project-Wide Device Overview.
When only "Devices" are referred to in the following, this also includes all types of data sources.
Data Sources and Devices
Sedrix supports devices for the following Sedrix modules:
Vibration measurement
Tachymeter
Logger
Inclinometer
More information can be found on this page.
Device Overview
The “Device Overview” is reached by clicking on the “Devices” icon (
All devices within the current project are listed in one table
In the “Online Status” column, directly after the name of the device, the current status is given in text form and highlighted in color (green: “Online”; red: “Offline”; grey: “Not monitored” etc.).
By clicking (repeatedly) on a column heading, the devices can be sorted according to the content of the clicked column (ascending or descending).
By entering a search term in the search field to the right above the table, the display is narrowed down according to the search term.
The following interactive features are available here:
Display or edit the properties of a device: Click on the “Edit” icon to the right of the name of the device.
Display device protocol of a device: Click on the “List” icon to the right of the name of the device.
“Alerts (re. online status) of a device: Click on the “exclamation mark” icon to the right of the name of the device.
Display device measuring points or channels and Display health data of a device (Menhir only): Click on the name of the device.
In addition, you can also view the properties of the device in compact form at the beginning of the view opened in this way.
Cross-Project Device Overview
Sedrix also offers a cross-project device overview. This provides a quick overview of the projects in which the devices of one Sedrix system are currently integrated. This function is especially designed for monitoring a large pool of devices and is normally only used if required by your system administrator/sales partner.
To access this view, first open the main menu by clicking on the “hamburger” button and then click on “Devices (All Projects)” below the project tree.
Please note the following differences compared with the project-related device management:
The reference to the project (the project to which a device is assigned) is established by a corresponding entry in the additional column “Project”. If a device has been used in more than one project (possibly under different names), it will be listed under the project (and with its name there) with which it had the last contact to Sedrix (in other words, at its last or current “location”).
Another additional “License” column gives an overview of the licensing status of each device.
This general view is only intended to provide a quick overview. It therefore does not allow you to add a device. However, editing existing devices etc. is possible here. (See the interactive features described in the following.)
The “Device Monitoring” column has been omitted here (this information would be too project-specific for this overview; it also saves some space).
Note:This function requires separate licensing. It is only available to users with the “Super-Administrator” and “Administrator” roles.
Add Devices
Sedrix can currently be used to manage the data of devices belonging to one of the following modules:
“Vibration” Module: See Add Vibration Device
“Tachymeter” Module: See Add Tachymeter Devices
“Logger” Module: See Add Data Logger Devices
More information can be found on this page.
Device Monitoring
The “Device Monitoring” function allows you to be informed at any time about the online/offline status of your devices in Sedrix.
General Information About Device Monitoring
As of version 2.10, Sedrix differentiates between passive and active device monitoring:
“Passive Device Monitoring”: Only the connection state of a device is displayed in Sedrix – as before.
“Active Device Monitoring”: If a device is offline for a predefined amount of time, Sedrix can actively inform you via email or SMS. Sedrix can also send alert messages when certain entries occur in the device log (see the “Log Entries” alert trigger).
While passive monitoring is already included in the basic version, a separate license is required for active monitoring (see the Notes below).
The criteria according to which a measuring device is no longer considered as online, as well as the actions that should be carried out during active monitoring, are defined for both passive and active monitoring in the project through the “Online State Alerting” alert definition. See the “Online State” alert trigger. Since these criteria are generally the same for many, if not all, devices, they can be managed centrally in the alert definition (unlike previously, when they were managed individually per device). If required, you can of course create several alert definitions with different criteria and use them to monitor different devices.
Notes
For newly created projects, an “Online State Alerting” alert definition is automatically created, which you can use to monitor your devices. For existing projects, this alert definition was added during the update to version 2.10, if none existed previously. These automatically created alert definitions are named “Standard Device Monitoring”.
Licensing: If at any point Sedrix notifies you that you do not have the required licenses (“No valid license found”), please contact your support partner.
Set Up Device Monitoring
To activate Device Monitoring for a device (see General Remarks On Device Monitoring), go to the desired device’s Device Manager in the “Edit” view. In the “Device Monitoring” tab, go to the “Online State Alert Definition” dropdown menu and select an “Online State Alerting” alert definition (see Alert Triggers). Clicking on the name of this alert definition takes you to the “Edit” view of the alert definition, where you can view or edit its properties.
Notes: You can define a new alert definition of this type, or, more simply, use the designated alert definition which is called “Default Device Monitor”.
Typically, the same alert definition is used to define the online/offline criteria for multiple devices. If necessary, create a new alert definition of this type if the criteria for the current device (and/or the desired actions in the event of an alert) are different from those used for previous devices.
Display Device Online/Offline States
Sedrix informs you about the online/offline status of your devices. This information is given in several different places.
Note: From version 2.10, device monitoring is defined out via an “online state alerting” alert definition (see Alert Triggers). See also General Remarks on Device Monitoring. To activate device monitoring for a device, see Set Up Device Monitoring.
"Dashboard" View
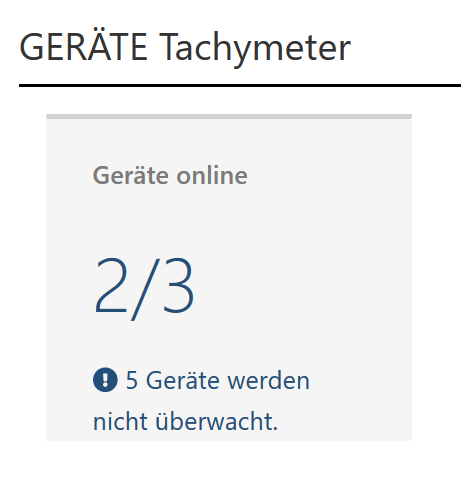
The dashboard gives you a rapid overview of the online/offline state of devices assigned to the current project, among other things. These are separated according to their type, i.e. “Seismic/Vibration”, “Tachymeter”, “Data Logger”. For example, when “2/3” is indicated in the “Devices Online” box, this means that 2 out of 3 devices are currently online, and 1 is offline.
Important: From version 2.10, only the devices that are actually being monitored are shown here. The additional lines below indicate whether there are also devices not being monitored:
"All devices are being monitored" or
e.g. "5 devices are not being monitored" (as in the screenshot).
In the case of the latter, you will need to add the 5 non-monitored devices to the 3 monitored devices to give the total number of devices of a certain type that are assigned to the project.
“Devices” View
In the Device Manager, your devices are listed in a table according to their type:
From version 2.10, there is an extra “NOT MONITORED” button alongside the existing filter buttons “ALL”, “ONLINE”, “DEVICE STILL OK” and “OFFLINE”.
The final line of a device with the “Device Monitoring” label gives the name of the alert definition set in the device. If no alert definition was selected, then this line will read “Not monitored”.
“Folder” View
For each folder or sub-folder within a project, all measuring points within the current folder will be listed in a table in the “Folder” view, one line per measuring point (available from version 2.10). Two columns give you a quick overview of the online/offline status of the assigned devices and also inform you about any connection problems that may have occurred:
The “ONLINE STATUS” column indicates whether the devices assigned to the respective measuring point are currently “ONLINE”, “OFFLINE” or “Not monitored”. If several devices are assigned to one measuring point, the online status will be summarized as “ONLINE” if all the measuring point devices are online, or as “OFFLINE” if one or more devices are offline.
If several devices are assigned to one measuring point, the online status of each individual device is displayed separately in the “DEVICES” column for each device, below its name.
Device Remote Access
Menhir and MCC TSC devices have their own web server, which you can use to connect to their configuration interface (“Web UI”) from the device overview. This allows you to configure your device remotely.
In the “Device remote access” column, in the line of the device you want to access, click on the button with the 
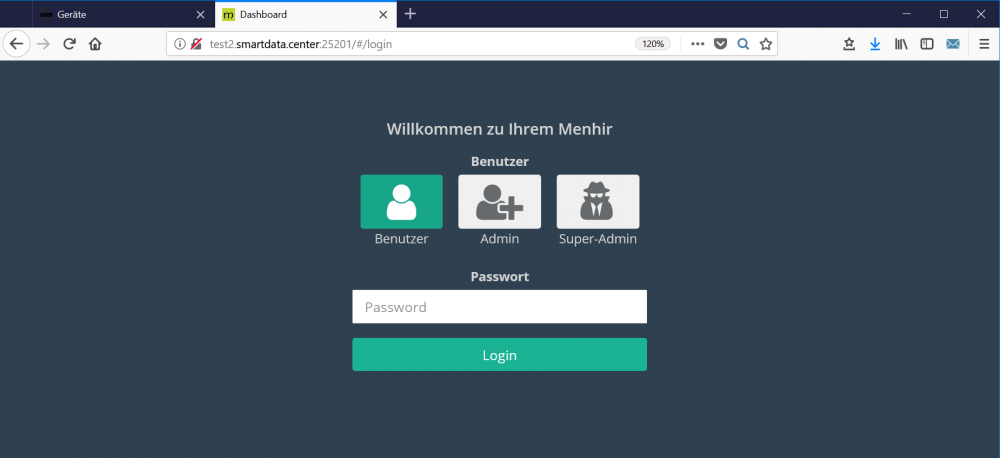
Example: The following screenshot shows the login mask of a menu that is displayed after a successful connection.
If necessary, contact your system administrator for required login details, or if there are questions surrounding actually configuring the device.