
Logbook
Introduction
With the “logbook” feature (introduced with version 2.11) it is possible to document events in Sedrix (manually or automatically) and to display the events along with the measurement data, which is especially relevant if these events are important for the interpretation of the data.
In addition to a descriptive text of the event, a logbook entry is therefore essentially defined by its start date and – to form a time period – by its end date. To structure the logbook, logbook entries can be assigned to a specific (sub)folder of the current project. Details can be found in Properties of Logbook Entries.
Examples of events that can be documented as logbook entries:
Maintenance periods,
Exchange of devices or sensors,
Periods of power outages,
Shock events such as explosions,
Other (relevant) events on the construction site, etc.
Graphical representation of logbook entries
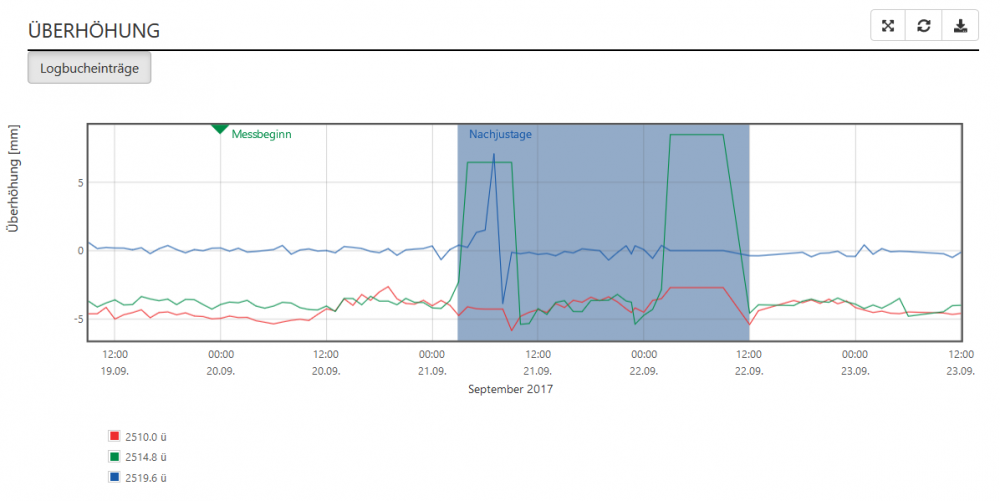
Currently, logbook entries in diagrams can be represented by a marker with a label (isolated event) or a colored rectangle (event that extends over a period of time).
The following screenshot shows an example of a diagram with measurement data and superimposed display of logbook entries with a logbook entry for a point event (label “Messbeginn”, i.e. “start of measurement”) and a time extended event (label “Nachjustage”, i.e. “adjustment”):
Note on licensing: This feature requires separate licensing.
Note on rights management: As a user you require the appropriate rights in order to manage the logbook.
These rights must be defined in the “Logbook” dropdown menu as a property of the user group to which the user belongs. Possible entries of the “Logbook” dropdown menu are “None”, “Read only”, “Edit”, “Create new” and “Delete”. Contact your Sedrix administrator if your rights are not sufficient for your needs. For more information on rights management, see User Group Properties.
Create Logbook Entries - Triggers
The normal process for Sedrix users, which is described in the following sections, is that a user manually creates a logbook entry.
Logbook entries can also be automatically created by the Sedrix server. In the future, for example, it is intended that when Sedrix is updated, this event will be automatically documented in a corresponding log entry, in which the downtime associated with the update will also be documented.
Since a logbook entry can be created in different ways, Sedrix also saves each entry’s “cause” or trigger for each entry. In normal use this is the name of the user, for automatically generated entries the name “System” (or “External”, which should only be mentioned here for the sake of thoroughness). This trigger is displayed in the logbook for each entry, in a separate column (see column 3 in the screenshot in “View Logbook And Manage Entries”).
For the normal way of manually creating log book entries, see View Logbook And Manage Entries.
Logbook Entry Properties
The following properties should be set for a logbook entry:
START (required)
Date and time of the (start) of the event being documented as the logbook entry.
Default: Current date and time.END (optional)
Date and time of the (end) of the event being documented as the logbook entry.
If given, this value must be later in time than the START value.PRIORITY (required)
Dropdown menu to select a number between 1 and 5.
This number can be freely selected and interpreted (for example to indicate the importance of the event).
It is assigned a color that is used for the graphical display of the event.
1: assigned color: red (i.e. to indicate the highest priority)
5: assigned color: purple (i.e. to indicate the lowest priority).
Default:1.FOLDER
Dropdown menu to select a folder or subfolder in the current project in order to restrict the visibility of the entry to the measuring points or to the evaluations that are assigned to the selected folder and all of its subfolders.
Default:-. The logbook entry is then displayed in the evaluations of all measuring points in the project – as long as the switch “Visible in evaluations” (see below) is set to “Yes” (the selection-thus corresponds to the selection of the project folder itself).SHORT TEXT (required)
Free text to succinctly describe the event, which is used as a label for the entry.
Maximum length: 20 characters.
Recommendation: Keep this text as short as possible, to reduce overlapping in the graphical depiction.TEXT (required)
Free text to describe the event in more detail.Switch Visible in evaluations
Determines whether or not the entry is always shown in measuring point evaluations.
Default:No.
View Logbook And Manage Entries
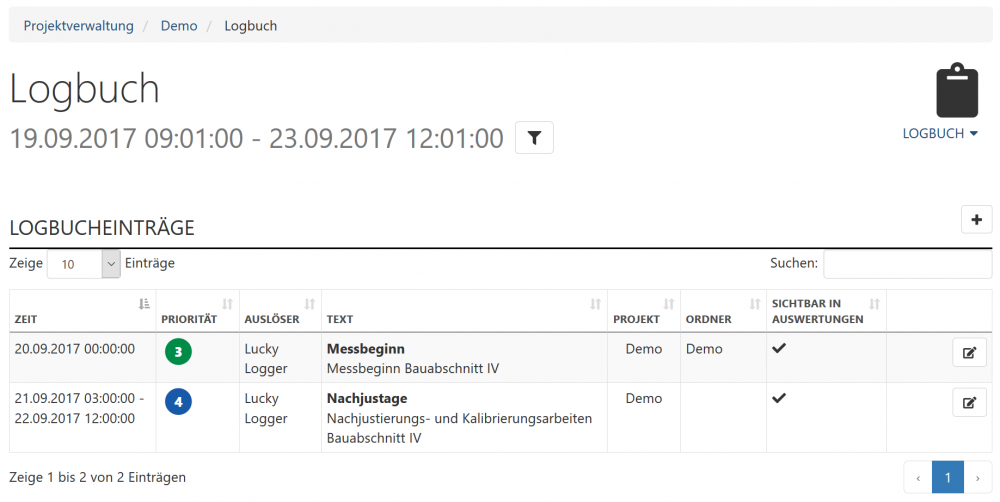
The logbook of the current project is opened by clicked on the “Clipboard” icon in the menu. A view is opened which displays a table of all the logbook entries for that project, along with their essential properties. The start times of the entries are listed according to the selected SmartFilter settings. See the screenshot below.
In the “TRIGGER” column, the name of the user who created the respective entry is given (as long as it was made manually by a user). For more details on the term “Trigger”, see here.
Screenshot of a logbook with the two logbook entries graphically displayed with measurement data:
Important: If certain entries cannot be seen, this is probably because the current SmartFilter settings have not been recorded. Change your filter settings accordingly.
If required, switch to the project whose logbook you wish to view/manage.
Click on the “Clipboard” icon to open the logbook.
To create a new logbook entry:
Click on the “+” icon in the top right.
Enter the properties of the new entry.
Click on “Save” to create the entry.
To edit an existing logbook entry:
Click on the “Edit” icon to the right of the entry.
Change the properties of the entry as desired.
Click on “Save” to save your changes.
To delete an existing logbook entry:
Click on the “waste bin” icon to the right of the entry.
Click on “Delete” in the window that opens, if you are sure you want to delete the entry. Click on “Cancel” to cancel the process.
Show/Hide Graphical Representation of Logbook Entries
Logbook entries that are represented in diagrams by a marker with a label (isolated event) or by a colored square (event extending over a period of time) can be hidden or shown by the user at any time.
To temporarily hide the logbook entries in a diagram, click on the “Logbook entries” switch to the left above the diagram (below the name of the evaluation, see the introductory screenshot).
To show the logbook entries again, click on this switch again.