
Any graph in an evaluation view can be directly exported using the export function.
To do so, click on the export symbol on the right:
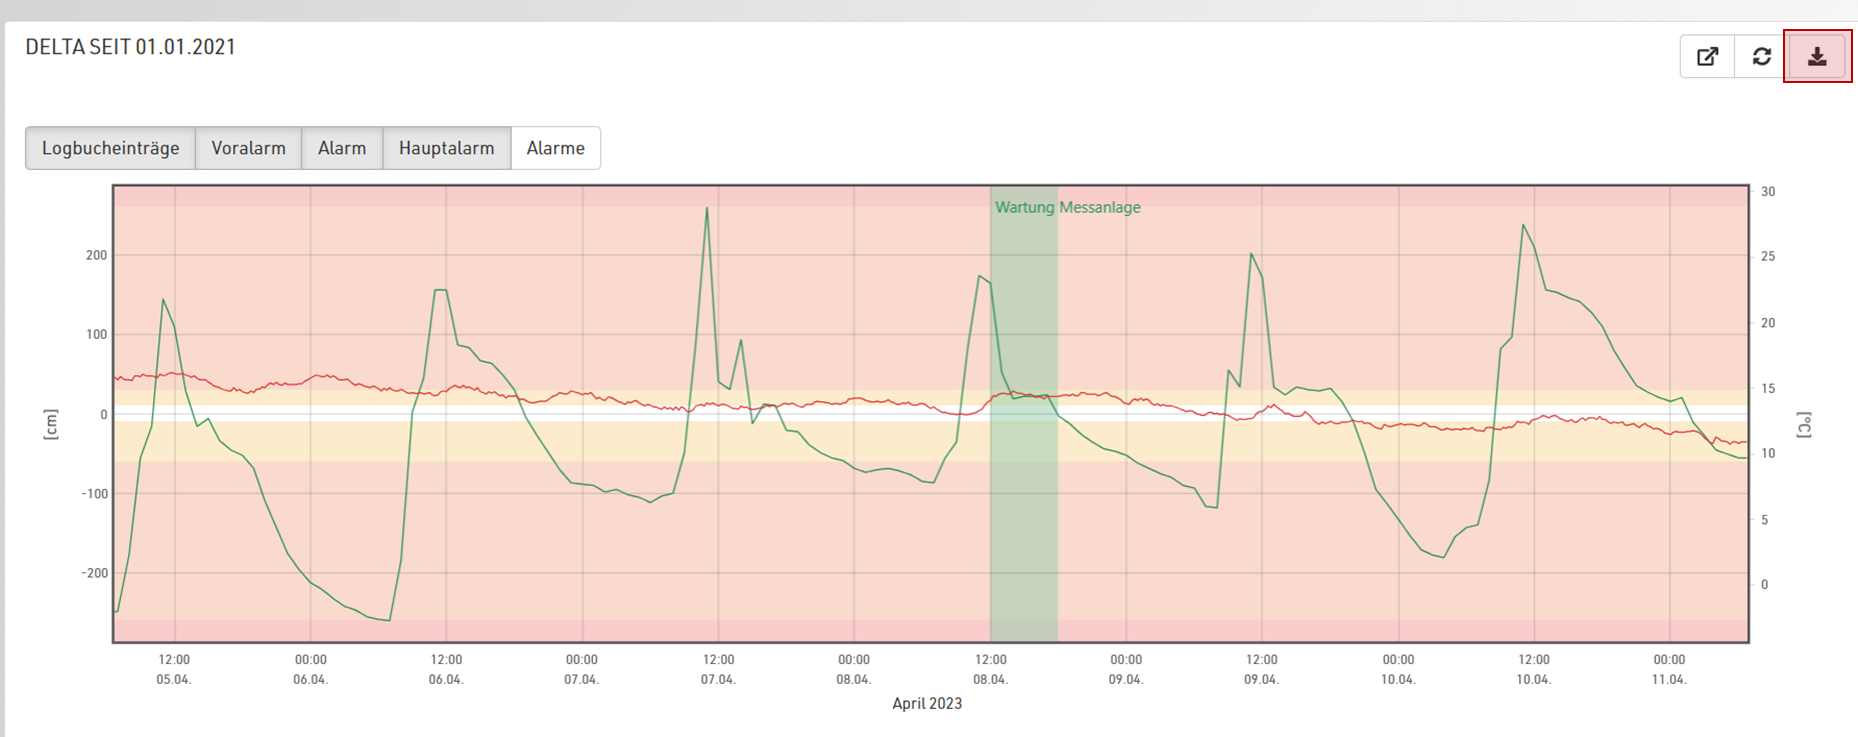
A dialog will open, where you set a file name, format and other properties for the export.
The time period of the export corresponds to the time period currently being displayed.
The following export formats are available:
|
|
Time-value measurements |
Geodetic measurements |
Oscillation measurements |
Inclinometer measurements |
|---|---|---|---|---|
|
Jpeg |
Yes |
Yes |
Yes |
Yes |
|
Png |
Yes |
Yes |
Yes |
Yes |
|
Bmp |
Yes |
Yes |
Yes |
Yes |
|
Tiff |
Yes |
Yes |
Yes |
Yes |
|
Gif |
Yes |
Yes |
Yes |
Yes |
|
CSV (table from diagram) |
Yes |
Yes |
Yes |
No |