In Sedrix, a measuring point is used to manage, analyze and display measuring data. They logically group individual measured valuables and therefore do not themselves contain any actual data. Rather, they are linked via assignments to a data source. The data source of a measuring point is a measuring channel.
The measuring point is therefore not the same as an individual physical measuring device. From Sedrix’s point of view, each physical measuring device produces one (or more) data streams. For a data logger, a single measuring channel could be temperature. This logger might also simultaneously measure humidity, in which case the logger would generate a second measuring channel, namely for humidity.
The measuring channels can now be assigned to measuring points. This can be done very flexibly. In the example above, both measuring channels could be assigned to one single measuring point, so that temperature and humidity can be related to one another. Perhaps other data loggers exist in other places, which also measure temperature. To merge these values, you could now assign to temperature measuring channel of each individual data logger to one single measuring point.
A measuring point can therefore contain several measuring channels from one or more measuring devices. It is also possible for it to contain just one measurement channel from one device. There are several types of measuring points in Sedrix, which correspond to the individual available modules:
Logger
Tachymeter
Seismic measurement (vibration)
Documents
Measuring channels in a measuring point are generally grouped logically. These can be chosen as desired. Here are a few examples:
Pressure sensor + air pressure sensor (logger) (grouped by measuring location)
A track section or catenary mast (tachymeter) (grouped by object being measured)
Borehole (measuring trajectory with inclincometer probe) (grouped by system)
A bundle of displacement sensors in e.g. a multi-extensometer (grouped by sensor type)
A bundle of displacement sensors in e.g. a multi-extensometer (grouped by sensor type)
Measuring points are not created directly within a project, but rather within folders and sub-folders of the project (where folders serve to structure the project, see also the beginning of the folders section). Measuring points are thus part of the project tree, which represents the entire folder hierarchy of a project with the measuring points contained within it.
The position of a measuring point within the project tree or its affiliation to a folder is visualized accordingly:
In the project tree: Connecting lines clearly emphasized by corresponding symbols (see below) and the hierarchy
In the measuring point list of a folder: Lists all measuring points defined in a certain folder.
In the navigation bar: By displaying the path to the current measuring point, starting from the project folder.
Symbols used
: Measuring point in general (used in the measuring point list, as well as in the top right in the Measuring point view, and in the Project tree
, greyed out and overlaid by a “crossed-out eye” symbol, : Measuring point that is not displayed in the project tree (slide switch “Show in project tree” in measuring point properties set to “No”; used in the measuring point list)
Measuring Point Types
Sedrix differentiates between different types of measuring point, according to the modules of the measuring devices whose data they manage.
Vibration measuring point
A “vibration” measuring point is used to process and display vibration data uploaded to Sedrix.
Tachymeter measuring point
A “Tachymeter” measuring point is used to process and display tachymetric data uploaded to Sedrix.
Document measuring point
A measuring point of this type is used to store documents that typically contain measurement data in any format. In contrast to the import of measurement data in CSV format (see Manual Import and Export of Measurement Data , this data is not automatically processed by Sedrix.
If the measurement data contained in the document describe a critical state (defined according to requirement), i.e. a state that requires an alerted, an alert can be generated manually. See Alert Trigger Document Upload.
Proceed as follows to upload a new document:
Select the desired measuring point of this type and select the “Manage documents” command in the context menu of the measuring point. Alternative: Click on the upload button, in the measuring point overview of the folder containing the desired measuring point.
Click on the upload button in the “Manage Documents” view that now opens to start uploading a document.
Enter the required information under “Settings”:
“Start” and “End” (optional) Calendar controls for specifying the validity period of the (measurement) data contained in the document to be uploaded.
“Comment”: Text field for entering a comment, and in particular:
“Select file…” Button which opens the file dialog when clicked, where you can select the document to be uploaded on your local computer.
Click on “Save” to upload the document.
The “Manage Documents” view that is again displayed shows the documents that have been uploaded so far (with the most recent at the top).
The date of the most recent document is used to determine the online status of the measuring point.
Data logger measuring point
A “Logger” measuring point is used to process and display data uploaded to Sedrix (such as from data loggers, manually measured data etc.).
Crossover Evaluations
Crossover evaluations serve to calculate and represent data from different Sedrix modules within one view. They can be understood as a kind of virtual measuring point, in which channels can be assigned whose data is then also used in function block calculations and can be displayed in evaluations , in the same way as the previously mentioned “real” measuring point types.
The only difference to the other types of measuring point is that the measuring point channels are not created by assigning device channels, but by incorporating measuring point channels that have already been created in other measuring points (by assigning device channels). Of course, both measuring point channels which directly depict measured data (input channels), along with those that contain calculated data (output channels) can be integrated within a crossover evaluation. The properties of a measuring point channel, such as properties to do with filtering and the calculation of a transfer function (for example for calculating a constant offset), are set as defined in the respective assignment of the “parent” measuring point.
Proceed as follows to create a new crossover evaluation:
Open the folder view of the folder in which the crossover evaluation is to be placed.
Click on the “+” icon in the top right of the “Measuring Points” tab and select “Crossover Evaluation” in the dropdown menu that appears.
Make sure to enter an unambiguous name for the crossover evaluation under Name .
Create the evaluation by clicking on “Save”.
Click on the “Assignments” tab to create new assignments for the evaluation.
Click on the “+” icon (or on the “Create new assignment” link, if no assignments have been created) and select the desired channels from the various modules.
Name Text field to enter an – optional – name for the assignment (or the measuring point channel being defined). If this field is left empty, the name of the selected channel is used as the name for the assignment.
Unit category Dropdown menu to select the unit category (distance, force, voltage), which meets the requirements of the channel to be selected later. After selecting a category, the table displayed below which lists the channels is filtered accordingly.
Application Dropdown menu to select the application which meets the requirements of the channel to be selected later, with the options “General”, “Data Logger” and “Tachymeter”. Default: “General” (channels with both “data logger” and “tachymeter” applications will be displayed). After selecting a category, the channel table is again filtered accordingly.
Channel table This table lists the channels of all measuring points in the current project from the module selected above with the name of the respective measuring point and the respective channel along with the unit of the measured data contained with it. Select the desired channel by marking it in the table (click on the row).
Then click on “Save” to create the assignment.
Notes:
If required, you can sort the table by clicking on one of the headings.
The channels displayed in the channel list can be narrowed down further by entering a search term in the search field in the top right above the table.
Important: After an assignment has been saved for the first time, the unit category that has been selected is fixed and can no longer be changed. If you notice that the unit category is incorrect, please delete the assignment and create a new one with the desired category.
Inclinometer Measuring Point
An “inclinometer” measuring point is used to manage and represent data measured with an inclinometer that is uploaded into Sedrix .
Measuring Point View
Measuring points also have their own view, the measuring point view which is diplayed in the data/work area . The measuring point view is reached by clicking/tapping on the name in the project tree, or by clicking/tapping on the name of the measuring point in the measuring point list (in the folder view). It is marked in the top right by the measuring point symbol
A measuring point view is especially used to display measurement data (with the exception of document measuring points). The data that is displayed is determined by you, the user, by defining the required so-called evaluations for the measuring point (in the properties of the measuring point, under the Evaluations tab, this is described in the Quickstart . However, further configuration steps need to be carried out beforehand, in particular the creation of assignments ). In this view, data can also be downloaded in a given format (data export) or as an image file (see the corresponding sections in Evaluations).
The content of a measuring point view is therefore essentially determined by the evaluations you have created. Otherwise, each measuring point view contains the following elements:
SmartFilter for temporarily filtering the data displayed in the evaluations.
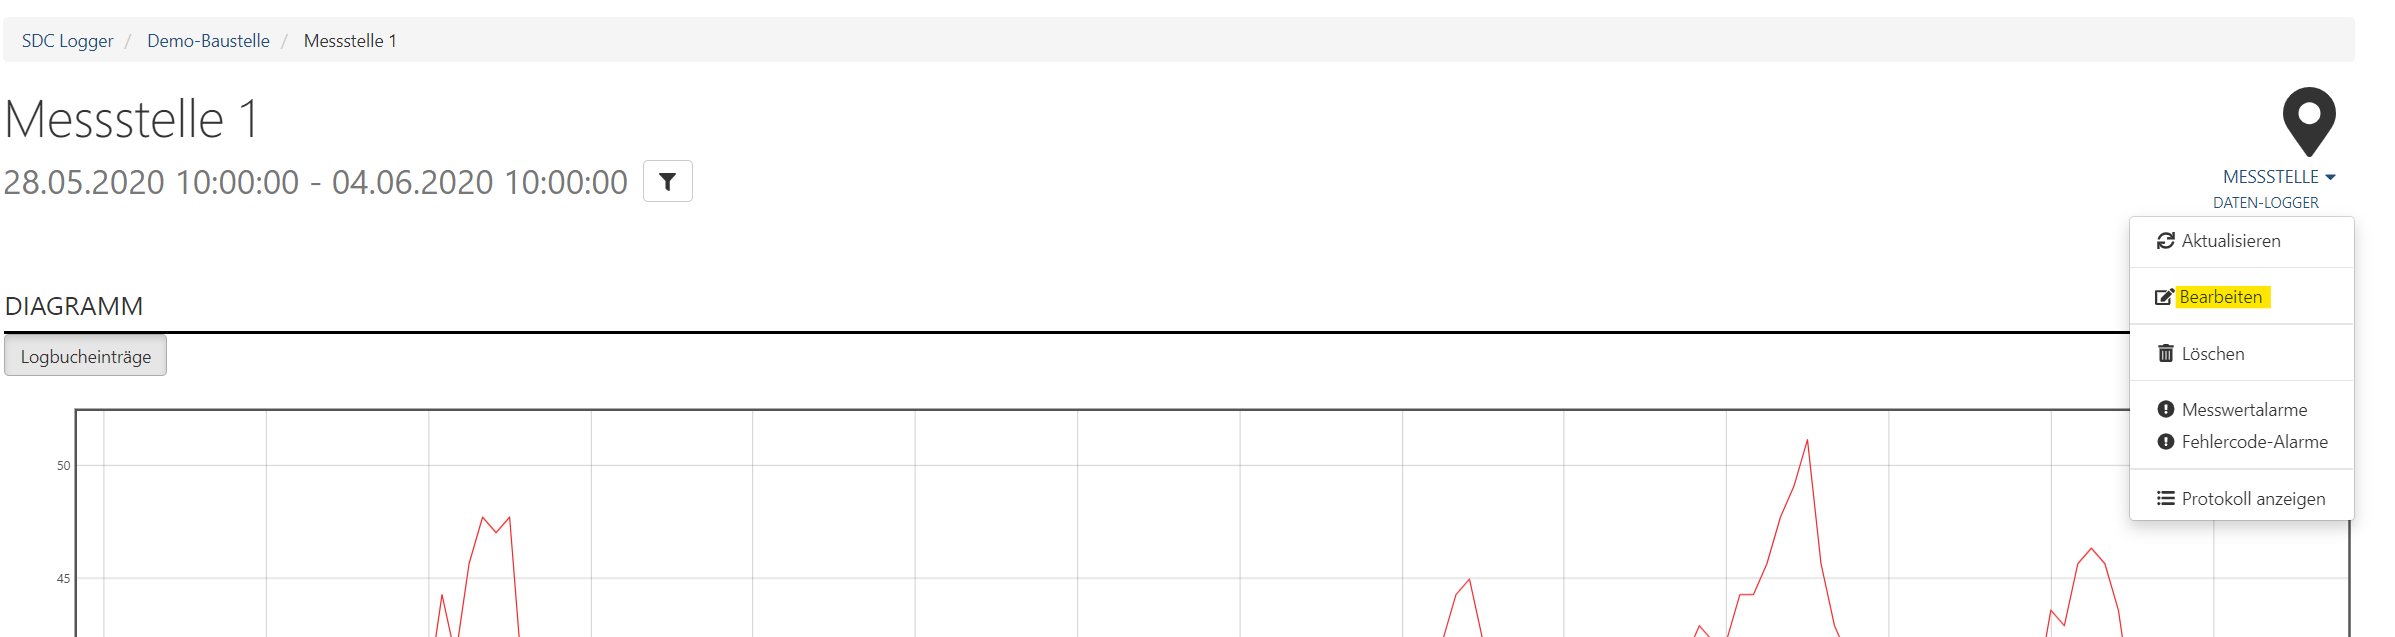
Context menu (accessible by clicking on the name of the measuring point below the measuring point symbol in the top right). Contains in particular the “Edit” command, which is used to enter the Edit mode of the measuring point in order to be able to specify the properties of the measuring point.
In addition, some interactive options are available for the various evaluations (display as single image; download of the displayed data as image or as CSV files). For details, see the descriptions of the individual evaluations in the subsections of Evaluations.
Finally, additional buttons for showing and hiding alerts, logbook entries , etc. can be displayed for the evaluations in a measuring point view. This is essentially self-explanatory and is not described here (a detailed written description would be rather confusing, or would at least make the text unnecessarily long).
Create Measuring Point
Measuring points are created within folders. This means that they are bound to folders. Therefore, if necessary, first create the folder in which the measuring point should be located (see also the introductory explanations in Creating the Folder Structure and Project Tree.
Proceed as follows to create a new measuring point:
In the project tree , select the folder or subfolder in which you want to create a measuring point.
In the “measuring points” tab in the data area of the folder view, click on the “Add” icon A small dropdown menu with the available measuring point types is displayed (the options provided here depends on the Sedrix modules licensed for your Sedrix).
Select the desired type. The “Add measuring point” view is displayed for the selected type.
Under “General” In the “Settings” tab, assign a name for the measuring point to be created. Important: This name must be unique within the project!
Finally click on “Save” to actually create the measuring point.
Then enter the desired properties in the remaining tabs
Click on “Save” again to save your changes.
Important: If you want to create a new measuring point, you can initially only enter data in the “Settings” tab. In the other tabs this is only possible after saving for the first time – this is also indicated by a message here. This is because the settings that are changed there require a measuring point that already exists.
The properties to be entered depend on the selected measuring point type. Please refer to the corresponding detailed descriptions in the subsections of Measuring Point Properties .
Measuring Point Properties
Measuring points are characterized by a multitude of properties. These properties can be viewed and (except for those defined during creation) changed in the Edit mode of a measuring point.
Besides the name of a measuring point and other general settings, the following important properties should be considered:
In the edit mode of a measuring point, there is a tab for each of these group of properties. After clicking on such a tab you can edit the corresponding properties in detail.
General Properties
General properties of a measuring point are stored in the “Settings” tab. There are also further sub-tabs within this tab, for better clarity. Other properties of a measuring point that can be configured here depend on the exact type of measuring point (velocity/acceleration measuring point, tachymeter measuring point etc., i.e. essentially the module to which the measuring point belongs)
“General” Sub-Tab
Name: Text field for entering the name of the new measuring point. It must be unique within the whole project.
Short name Text field for entering the short name of the new measuring point (optional)
Description Text field for entering a description of the new measuring point (optional)
Type Text field for entering a user-defined type of the new measuring point. Note:This information can be freely chosen independent of the “actual type” of the measuring point (corresponding to the Sedrix module to which the measuring point belongs), which was chosen in the context menu when creating the measuring point – and which cannot be changed.
Folder Dropdown menu for selecting the folder to which the new measuring point is to be assigned. The dropdown menu contains all folders within the project tree. Default: Current folder. By choosing another folder as the “target”, the new measuring point can be assigned to another folder in the project.
Display in project tree Slide switch for determining whether the measuring point is displayed in the project tree or not. Default: “Yes”. If “No” is selected, the measuring point is not displayed in the project tree. Such a measuring point will only be listed in the folder view .
Archived Slide switch for determining whether the measuring point is considered “no longer active” or “archived”. Default: “No”. If “Yes” is set the measuring point is marked as “archived” and is no longer taken into account when the active measuring points are displayed in the graphical user interface (lists of measuring points, project tree). To list such a measuring point, click on the text link “Archived measuring points” in the Folder view . An archived measuring point is therefore still present in the Sedrix (this means it is not deleted). It can be edited, which means that it can be unarchived or reactivated at any time by moving the slide switch back.
“Visualization with Google Maps” Sub-Tab
Note: The settings made here refer to the visualization of the location of the measuring point in the folder view of the folder in which the measuring point is located. They are active/applied if the visualization for this folder is set via “Google Maps” (see folder properties, Visualization tab, and more in detail in the description of the properties of a folder visualization, Properties for “Google Maps” Visualization). In this case a measuring point symbol is placed at the coordinates specified here for the measuring point on the Google Maps map displayed in the folder view.
Show on map Checkbox to specify that a marker will be displayed at the position of the measuring point specified by latitude and longitude (see below).
For “velocity measuring point” measuring points (velocity measuring point) or “acceleration measuring point” measuring points (acceleration measuring point), the parameters of the vibration standard(s) according to which vibration events are to be evaluated can be specified in these sub-tabs.
In addition to input elements for the specific properties of the respective standard, each of these sub-tabs has a “Apply standard XYZ“ checkbox. Select this checkbox if the corresponding standard is to be applied. This makes it possible to (temporarily) exclude standards from the analysis without losing the previously made specifications for the properties of the standard.
“Advanced” Sub-Tab (Tachymeter and Logger measuring points)
As soon as the data of several different channels has to displayed in a table evaluation of measuring points of type tachymeter measuring point and data logger measuring point , it is necessary to bring these channels into a common time grid . The same applies to the calculation of function blocks : function blocks with more than one input channel . The following properties can be defined here to configure the corresponding algorithm:
Raw value tolerance interval Text field for specifying a time interval in hours. Within this interval, measured values are searched as alternative values if no measured values exist in the input channel for certain time stamps (see also the text of the blue info box).
Precision for merging of timestamps Dropdown menu for specifying an precision that is taken into account when providing a common time grid for the data of several channels (see also the text of the blue info box).
Assignments
In Sedrix, an assignment is the association of a device with a measuring point. More precisely: The association of
An assignment therefore connectsa device to a measuring point, and thus the measurement data of the device with the (Sedrix) measuring point, which manages and displays this data. Accordingly, assignments are defined in the edit mode of a (en) Measuring Points .
An assignment creates a (measuring point) channel from the chosen device measuring point (tachymeter module), or (device) channel (module logger), whose data is then either directly displayed by means of an evaluation or which can serve as input of a function block .
Assignments are valid for a defined period of time (whereby this can also be open “towards the future” (i.e. specifying the end time is optional). Depending on the application, several assignments per measuring point are possible, even ones which overlap. This means that sensor failures, measuring instrument changes or measured value jumps can be managed simply and clearly.
To create assignments for devices of the different modules, see Assign Devices To Measuring Points. There, the slightly different properties of an assignment are explained depending on the module.
Properties for the Preprocessing of Measured Data
When using the basic settings, the measurement data of a channel defined by an assignment flows directly, as raw data, into further processing by Sedrix. However, by using certain properties within an assignment, it can be specified whether this data is preprocessed in various ways.
General Calculations (Logger module only)
When defining an assignment, a formula can be specified for the integrated channel as a transfer function. This formula can be set entirely at will. This means that during processing by Sedrix, the measured values of the channel are converted accordingly before they are displayed in an evaluation, for example, or incorporated in a function block. An offset value can be therefore taken into account, for example, or any desired calculations (corrections, unit conversions, etc.) can also be made.
Properties to be specified:
Transfer function Text field to enter a formula. The string m1serves as a variable for the measured values of the (single) channel entering the formula. Of course, for more complex formulas, the variable can occur several times in the formula.
Unit category of the result Dropdown menu to select the desired unit category of the result of the formula calculation. Default: “Unknown”.
Unit of the result Dropdown menu to select the desired unit. Default: Empty, or the first unit of the unit category selected in the previous drop-down menu.
If the user does not enter a formula into the “Transfer function” text field when creating a new assignment, Sedrix will automatically enter the following formula when the assignment is saved:
m1 [<device channel unit>]
This means that the measured values of the channel are taken directly (i.e. as raw values) for further processing.
Examples of user-specified formulae
For example, to specify that a specific fixed value – the offset value – is added to each raw data value, the following must be entered as the transfer function in the so-called text field:
m1 + <Offset-Value>.
Unless specified by the user, the unit of the integrated device channel is automatically added in square brackets after every occurrence of the variable, for example for the voltage unit mV:
m1 [mV] + <Offset-Wert>.
The offset value must of course be specified in the selected or automatically added unit.
Displaying the selected formula: The transfer function specified in an assignment is displayed in the Edit mode of the measuring point in the “Formula” column in the “Assignments” tab. y is used here as the variable of the calculation results. This is also followed by the unit chosen for the result in square brackets, e.g.: y[mm] = m1 [mV].
Here, “mm” has been chosen as the unit for the result from the “Distance” unit category.
Filtering Data
To filter the measurement data of a channel (tachymeter and logger modules) that can be defined by means of the corresponding properties of an assignment, see Filtering Measurement Data.
Reference Measurements
In Sedrix, a reference measurement is a measurement at a certain point in time that can serve as a “zero measurement”, i.e. as a reference for all subsequent measurements.
Reference measurements can be defined for measuring points of the “Tachymeter” and “Logger” modules (but not for measuring points of the “Vibration” module).
In order to create a reference measurement in Sedrix, the point in time at which measurement data should serve as a reference must be specified. These additional properties of a reference measurement are described in detail in the following section.
Create Reference Measurement
The properties of a reference measurement specified when a reference measurement is created (or later edited) at first determine the point in time for which a reference measurement is to be searched for and how this search will be performed. As soon as the reference measurement has been created by clicking on the blue “Update channels” button (see below) or changes made have been applied, Sedrix searches for suitable measurement data for the individual channels of the measuring point.
The results are displayed below the properties (and the blue button) in the “Reference measurements per channel” area, where they can optionally be edited.
Properties of a reference measurement
Time Date selection element for specifying the time point for which a reference measurement will be searched in the data.
Comment Text field for entering a comment.
Tolerance interval Text field for entering the number of hours to specify a time interval within which a reference measurement is searched for.
Search mode Dropdown menu for selecting the search mode Default: “Next value”. Further selection options: “Next value in the future”, “Next value in the past”, “Interpolate value”.
Overwrite user-defined reference values
As mentioned in the introduction, the value of the reference measurement found by Sedrix for a channel can be overwritten manually if necessary. Selecting this checkbox allows you to specify that the values entered by the user can be overwritten by the values determined by Sedrix according to the specified search criteria.
Finally, click on the blue “Update Channels” button to create a new reference measurement or to accept changes.
Reference measurements per channel
In this area, the measured values determined by Sedrix according to the search criteria specified in the above properties together with the time stamp are displayed for each channel.
If necessary, click on the pen symbol at the end of the row for a channel to overwrite the reference value. This will first take you to the Edit mode for the channel:
Enter the desired value in the text field of the “Measured value” column.
Click on the checkmark icon , to apply the change, or click on the “x” icon
, to cancel editing.
A pen symbol in front of the value indicates that a reference measured value has been changed by the user.
Click on the refresh icon to undo the manual change.
Input Channels
In Sedrix, an input channel denotes a certain physical quantity supplied by a measuring device in order to measure the “stream of measurement data” through this channel over time.
Function Blocks
With a so-called function block it is possible to calculate values for additional channels, the output channels, from the values of channels of a measuring point, the input channels. A function block can be further configured with Parameters as additional input variables.
Note: The function blocks described below usually expect values in a certain unit as input values. Accordingly, only channels that are compatible with the respective function block can be chosen as input channels.
In Sedrix, an output channel denotes a certain calculated quantity supplied by a function block or the “flow of” calculated “data” through this channel over time.
Evaluations
Evaluations are used in Sedrix to visualize measured data from a measuring device (whereby measuring devices are linked to a measuring points via a so-called assignment). This can be done in text form (in a table) or graphically (as a diagram). In addition, Sedrix provides various specialized visualizations (dependent on the module) alongside the “classic” tables and diagrams. There are also “pseudo evaluations” for structuring evaluations and displaying image files, if desired (e.g. a plan for the visualization of the spatial conditions of a measuring point).
More information can be found here. After a general introduction to how evaluations are used (adding, changing, deleting, changing the configuration of evaluations in the measuring point view), the various evaluations per module will be described.
Set and Define Measuring Point Variables
Variables serve as placeholders for values that have been centrally defined elsewhere. A variable can be entered in an input field of a function block or an evaluation, like a normal value (include $ as part of the variable name). Sedrix then reads in the value assigned to the variable. A value that is required in several places only has to be entered in one place. It can then be used as often as required and changed quickly and centrally if necessary.
When using variables, it must be noted that these are only entered in fields that correspond to their assigned value. For example, if a variable is assigned a text as a value, it can only be entered in fields that allow text input, not in those that require numerical input.
There are two types of variables:
Global variables: Global variables are not defined in a single measuring point, but in the project settings. Global variables can be used in the entire project, i.e. in all measuring points belonging to the project. More details here.
Measuring point variables, or local variables: Separate variables can be created for measuring points, but in contrast to global variables, these can only be used in input fields of the respective measuring point.
Set up measuring point variables:
To create this, right click on the icon at the corresponding measuring point and select the “Edit” item.
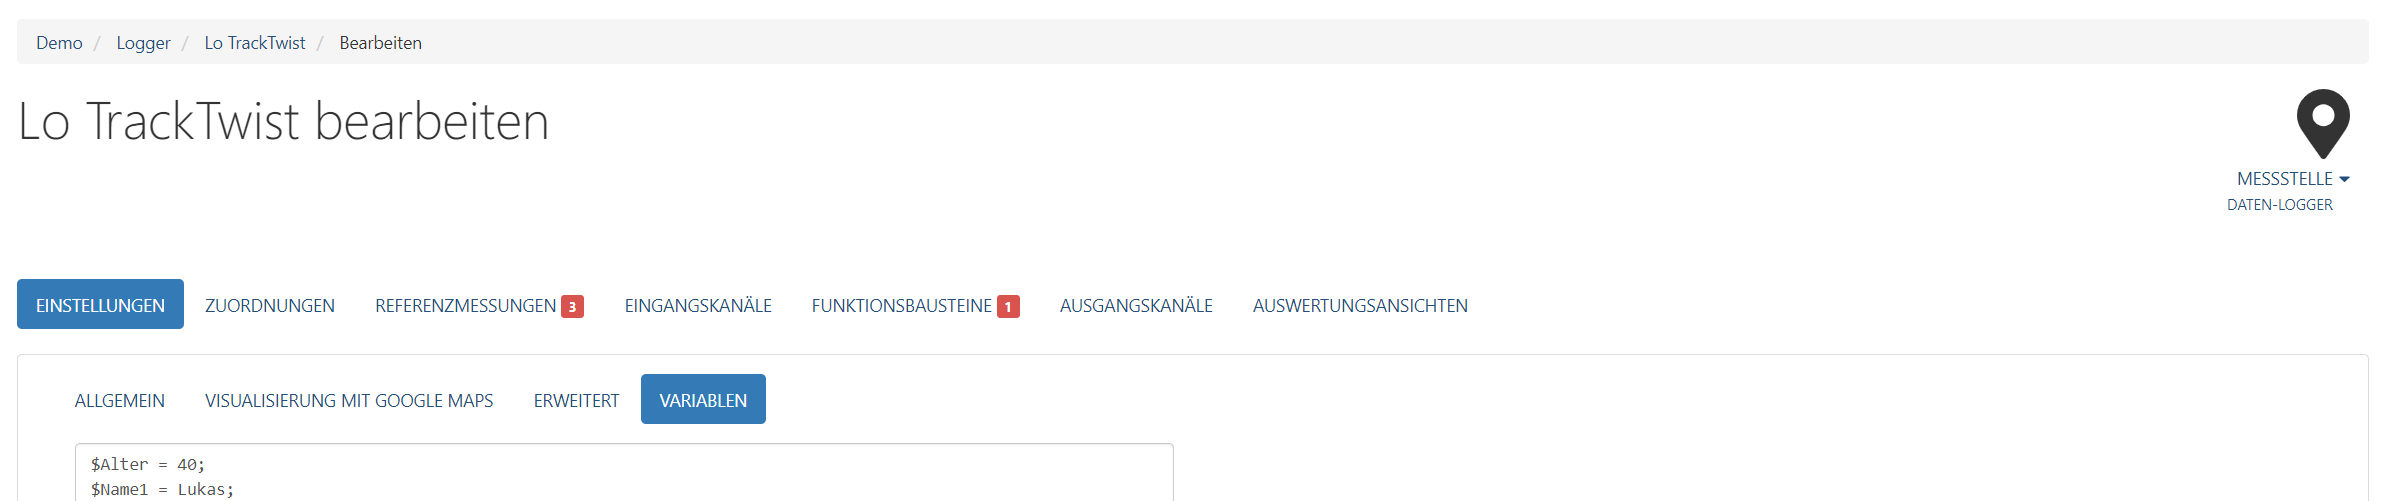
The “Variables” sub-tab can then be found in the “Settings” tab. New variables can be entered in the text field or existing variables can be changed. When all changes have been completed, the entry can be closed by clicking the “Save” button at the bottom of the page.
Define measuring point variables:
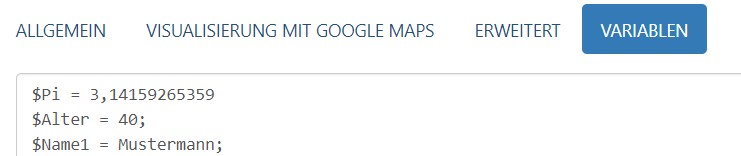
To create variables and assign a value to them (to define them), you can simply enter them in the text field. The name of each variable must begin with the $ character. The following part of the name can be chosen freely. After the equal sign, the value that is assigned to the variable can be entered.
Syntax for creating variables:
CODE
$VariablenName = WertVariable
Assign Devices To A Measuring Point
To be able to process, analyze and display the measured values of a device (in graphs or tables), the device must first be linked to a measuring point. This is done by creating a so-called assignment.
If required, the measured values supplied by the device can be further processed with the aid of function blocks: The measured values from the device flow as input channels into a function block, which calculates new values out of them and makes them available in so-called output channels .
Adding an assignment for the various modules is described in the following sections.
Assign A Vibration Measuring Device To A Vibration Measuring Point
The assignment of a vibration measuring point assigns a vibration measurement device – or more precisely, a device measuring point – to this Sedrix measuring point. This means that the measuring data of the device “flows” into this measuring point, so that they can be processed/analyzed and displayed here.
A vibration measuring point can be assigned to only one device measuring point at one moment in time. In other words, assignments must not overlap in time.
Properties of a vibration measurement assignment:
Device measuring point
Period of validity for the assignment:
From Calendar element to specify the start time of the assignment.
To Calendar element to specify the end time of the assignment.
Comment Text field to add a comment.
Further options: An existing assignment can be split by clicking on . Important:It is also the case here that the period of validity for the two assignments created in this way must not overlap in time.
Assign A Tachymeter To A Tachymeter Measuring Point
The assignment of a tachymeter measuring point assigns a tachymeter device – or more precisely, a specific measuring point of a device measuring point – to this Sedrix measuring point. This means that the measuring data of the device “flows” into this measuring point, so that they can be processed/analyzed and displayed here.
Properties of a tachymeter assignment
Name (optional) Text field to enter the name of the assignment.
Comment (optional) Text field to enter a comment.
Device measuring point Dropdown menu to select a tachymeter device measuring point from a list of all device measuring points of all devices assigned to the project. The device measuring points in the list are sorted according to name (from version 2.13).
Measuring point Dropdown menu to select a measuring point from the tachymeter device measuring point selected in the previous step. Only the measuring points defined for the selected device are displayed. The measuring points in the list are sorted according to name (from version 2.13).
Period of validity for the assignment:
Start Calendar element to specify the start time of the assignment.
End (optional) Calendar element to specify the end time of the assignment. If nothing is specified for “End”, the “future” period of validity for the assignment is unlimited.
Offset (optional) Text fields to enter offset values in mm. These values will be added to the corresponding measured coordinates for editing/display.
1The notation used here for the coordinate axes is set via the current project settings tab for “Coordinate system” and “Coordinate notation”.
Assign A Data Logger To A Data Logger Measuring Point
The assignment of a logger measuring point assigns a data logger device – or more precisely, a specific measuring point of a device measuring point – to this Sedrix measuring point. This means that the measuring data of the device “flows” into this measuring point, so that they can be processed/analyzed and displayed here.
Properties of a logger assignment
Name (optional) Text field to enter the name of the assignment.
Comment Text field to enter a comment.
Device (optional) Dropdown menu to select a logger device from a list of all device measuring points of all devices assigned to the project.
Channel Dropdown menu to select a channel of the logger device selected under “Device”.
Period of validity for the assignment:
Start Calendar element to specify the start time of the assignment.
End (optional) Calendar element to specify the end time of the assignment. If nothing is specified for “End”, the “future” period of validity for the assignment is unlimited.
Offset Text field to enter an offset value in the unit of the selected channel. These values will be added to the corresponding measured coordinates for editing/display.
To assign a data logger (for details on adding a data logger to Sedrix, see Add data logger devices) to a measuring point, proceed as follows for each channel whose data should be displayed in the measuring point:
Go to the desired logger measuring point and then to the “Edit” view (if no such measuring point exists, create one in the desired project or project folder, as described under Manage Measuring Points).
Click on “Create new assignment” in the “Assignments” tab, or on the “+” symbol in the top right.
Give the assignment a unique name.
Select the desired logger from the dropdown list of “Devices”.
Select the desired channel from the dropdown list.
Set the start time; the end time can remain empty.
Enter an offset, if required.
Finally click on “Save” to create the assignment.
Editing an existing assignment is done in a similar way.
Assign an Inclinometer Data Source to an Inclinometer Measuring Point
Properties of an inclinometer assignment
Name (optional) Text field to enter the name of the assignment.
Comment Text field to add a comment
Device (optional) Dropdown menu to select an inclinometer data source from a list of all data sources assigned to the project.
Period of validity for the assignment:
Start Calendar element to specify the start time of the assignment
End (optional) Calendar element to specify the end time of the assignment. If nothing is specified for “End”, the “future” period of validity for the assignment is unlimited.
Offset Text field to enter an offset value in the unit of the selected channel. These values will be added to the corresponding measured coordinates for editing/display.
To assign an inclinometer (for details on adding an inclinometer to Sedrix, see Add data logger devices) to a measuring point, proceed as follows for each channel whose data should be displayed in the measuring point:
Go to the desired inclinometer measuring point and then to the “Edit” view (if no such measuring point exists, create one in the desired project or project folder, as described under Manage Measuring Points).
Click on “Create new assignment” in the “Assignments” tab, or on the “+” symbol in the top right:
Give the assignment a unique name.
Select the desired inclinometer data source from the dropdown list of “Devices”.
Set the start time; the end time can remain empty.
Enter an offset, if required.
Finally click on “Save” to create the assignment.
Editing an existing assignment is done in a similar way.
Duplicate Measuring Points
Vibration, tachymeter and logger measuring points can also be created by “duplicating” (copying) a measuring point that already exists in the same project. This means that instead of creating and configuring a new measuring point from scratch, you can also create a new measuring point simply by cloning an existing measuring point that has already been configured (ideally) appropriately and then adapting the duplicate as required, which saves a great deal of time if you have to set up several “similar” measuring points.
Proceed as follows to clone/duplicate an existing measuring point within a project:
Open the folder view, in which the measuring point you want to duplicate is defined.
In the “Measuring points” tab, click on the “Duplicate” icon
at the very end of the row of the measuring point that is intended to serve as the template for the new measuring point.
In the dialog window that opens, enter the desired general properties (see General Properties of Measuring Points) of the new measuring point to be created as a duplicate:
Name Text field to enter the name of the new measuring point. It must be unique for the whole project. Default: Name of the template (i.e. the duplicated measuring point), followed by the string (copy).
Short name Text field to enter the short name of the new measuring point (optional) Default: Short name of the template, if specified for it, followed by the string (copy).
Description Text field to enter a description of the new measuring point (optional).
Type Text field to enter a user-defined type of the new measuring point. Note: This information can be chosen freely and independently of the actual “type” of the measuring point chosen as template (this actual type (velocity/acceleration, tachymeter measuring point etc.) is determined by the associated module and cannot be changed). Default: Type of template.
Folder Dropdown menu to select the folder in which the new measuring point should be placed. The dropdown menu contains all folders of the project tree. Default: Folder of the template. By selecting another folder as “target” the new measuring point can be assigned to another folder of the project.
Then specify the parts of the template that should be copied (i. e. how “complete” the copy should be) by checking the corresponding checkboxes:
Duplicate assignments Checkbox. If checked, the assignments of the measuring point serving as template are also copied.
Duplicate reference measurements (only for vibration and logger measuring points) Checkbox. If checked, the reference measurements of the measuring point serving as template are also copied.
Duplicate function blocks (only for tachymeter and logger measuring points) Checkbox (only active if the checkbox “Duplicate assignments” is checked). If checked, the function blocks of the measuring point serving as template are also copied.
Duplicate evaluations Checkbox (only active if the checkbox “Duplicate assignments” is checked). If checked, the evaluations of the measuring point serving as template are also copied.
Finally, click on “Save” to create the new measurement place.
A complete duplicate of a measuring point (all checkboxes marked in the clone dialog) is immediately fully functional.
Then the measuring point duplicate can be configured according to your needs as usual in the edit mode, unless you have created a mere copy of it, by clicking on the “Edit” button at the end of the row of the cloned measuring point in the measuring point overview.
Note: As mentioned above, evaluations and function blocks can only be copied if assignments are also copied, because the former depend on the latter. However, often one would like to use other assignments for the duplicated measuring point – which is possible at any time by editing the assignments (cf. the concluding sentence in the description above).
Note: The “Duplicate measuring point” dialog does not contain all the settings you are used to from the “Create new measuring point / Edit measuring point” view (compare with Measuring Point Properties; e.g. the slide switch “Show in project tree” is missing here) to keep the dialog slim. Instead, these properties are transferred 1:1 from the template to the new measuring point. However, these properties of the new measuring point can also be changed as desired at any time after cloning.
Manage Measuring Points
In the “Manage measuring points” view it is possible to edit several measuring points simultaneously in order to carry out certain similar actions in a time-saving manner. You can reach this view from a folder view via the “Measuring points” tab by clicking on the symbol above the list of measuring points. Alternatively you can use the command “Manage measuring points” in the context menu of the folder.
In addition, the usual buttons for editing, accessing the user log, etc. of a measurement point are available here (if your rights allow this).
Procedure
First open the folder whose measuring points you want to manage.
In the “Measuring points” tab, click on
to open the “Manage measuring points” view.
Select the measuring points to be edited simultaneously one by one by clicking the corresponding rows with the mouse. To deselect a (accidentally) selected measuring point, simply click on its line again. Attention: You can click anywhere in the line of a measuring point – except on the name, because the name is realized as a link, and clicking that link will forward you to the corresponding measuring point view (and of course not on the buttons at the end of the line).
Now start the desired action under “Actions for selected measuring points”.
Click on “Add” to open the view corresponding to the action. Make the desired entries here. When adding a reference measurement, in principle the same view for adding a reference measurement at a single measurement point is displayed (see Add Reference Measurement), supplemented by an overview of the selected measurement points (table with measurement point names, folder and already existing reference measurements).
If the selected action is not applicable to one or more of the selected points, the action will be executed with a corresponding warning (“Points are not compatible with this action and have therefore been skipped”) or, if the action is not applicable to any of the selected points, with a warning (“No compatible points selected”).
JavaScript errors detected
Please note, these errors can depend on your browser setup.
If this problem persists, please contact our support.